Visualize Workflows with Curved Step Process Flows
Product Description
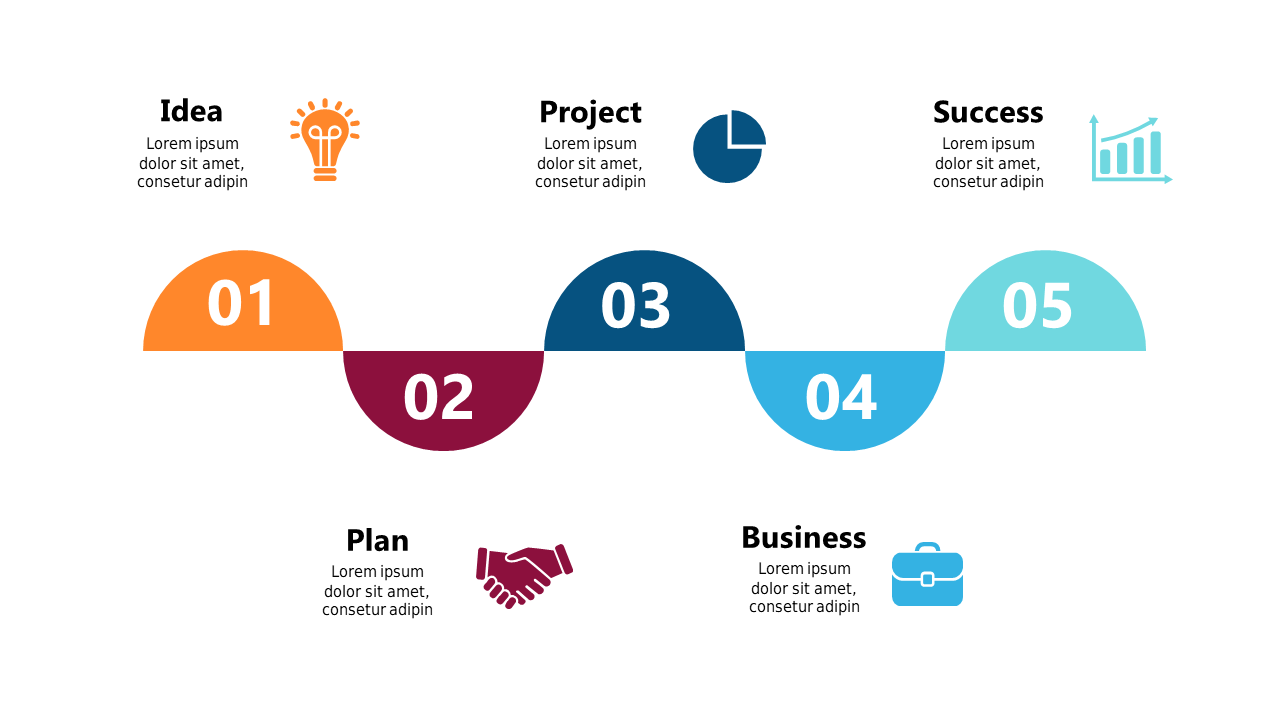
When you need to illustrate complex workflows, clarity becomes crucial. Complicated processes can confuse your audience, making it hard for them to grasp key steps and decisions.
A well-structured visual can bridge that gap and guide everyone through the process with ease. This slide is perfect for project managers, operations specialists, and consultants who need to present project phases or strategic processes during team meetings or client briefings. Whether you’re mapping out a project timeline or outlining a new operational strategy, this slide will help you convey your message effectively.
At just $0.99, you can download this slide instantly, customize the text and icons, and have it ready in PowerPoint or Google Slides within minutes. Simple editing allows you to tailor it to your specific needs, making your presentations visually engaging and informative.
$0.99 – Purchase Checkout
Added to cart







