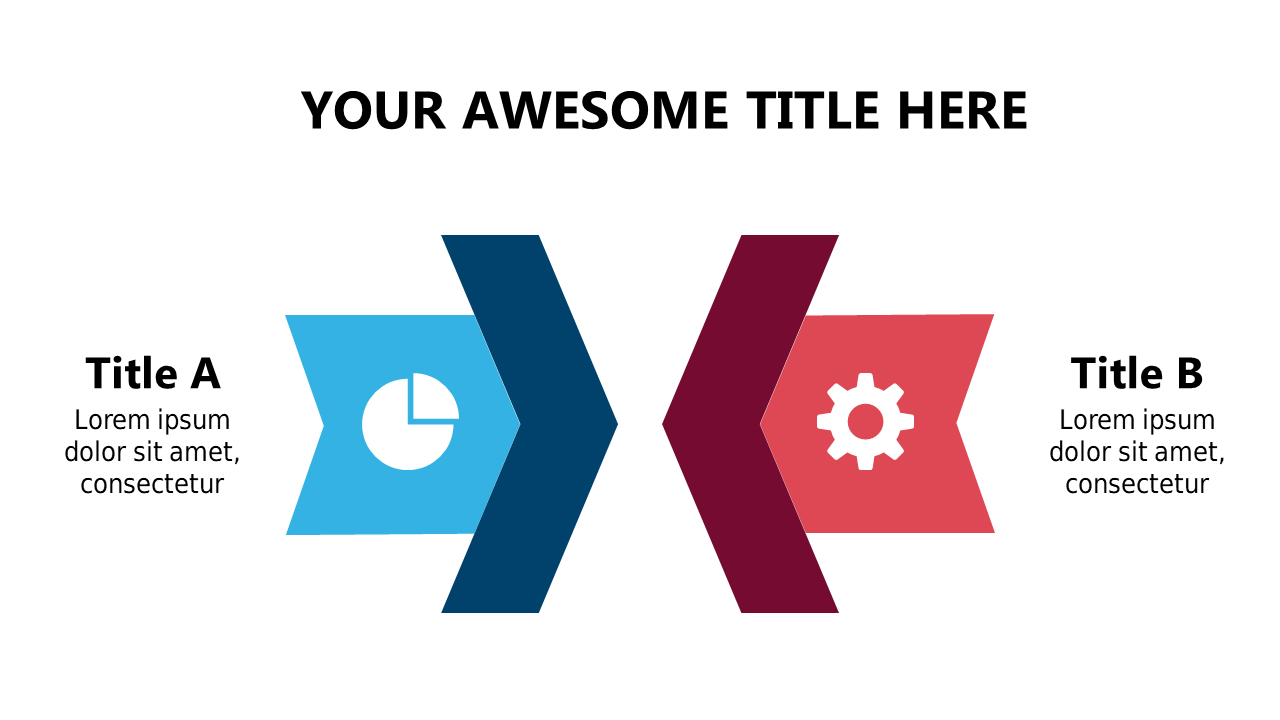
In today’s fast-paced work environment, clearly comparing processes can be challenging. This slide provides a dynamic dual arrow layout that visually represents different stages or workflows, making complex information easily digestible. With engaging icons placed along the arrows, you can quickly convey the relationship between two distinct processes or ideas. A business analyst can use this layout to present data-driven insights comparing operational efficiencies. A team lead might find it beneficial for illustrating the workflow of two different project teams, highlighting strengths and areas for improvement. Meanwhile, an operations manager can leverage this slide to compare traditional and innovative processes, showcasing potential improvements. The layout is fully editable, allowing you to customize colors, icons, and text to suit your branding.
$0.99 —
add this single slide to any deck from the SlideSwift Slide Library. No subscription needed. Mix slides from any category to build your perfect deck. Fully compatible with Microsoft PowerPoint and Google Slides — swap colors, fonts, icons, and text in minutes to match your brand guidelines or corporate deck theme without any design experience.
$0.99 – Purchase Checkout
Added to cart
 SlideSwift