Visualize Concepts with Connected Nodes Design
Product Description
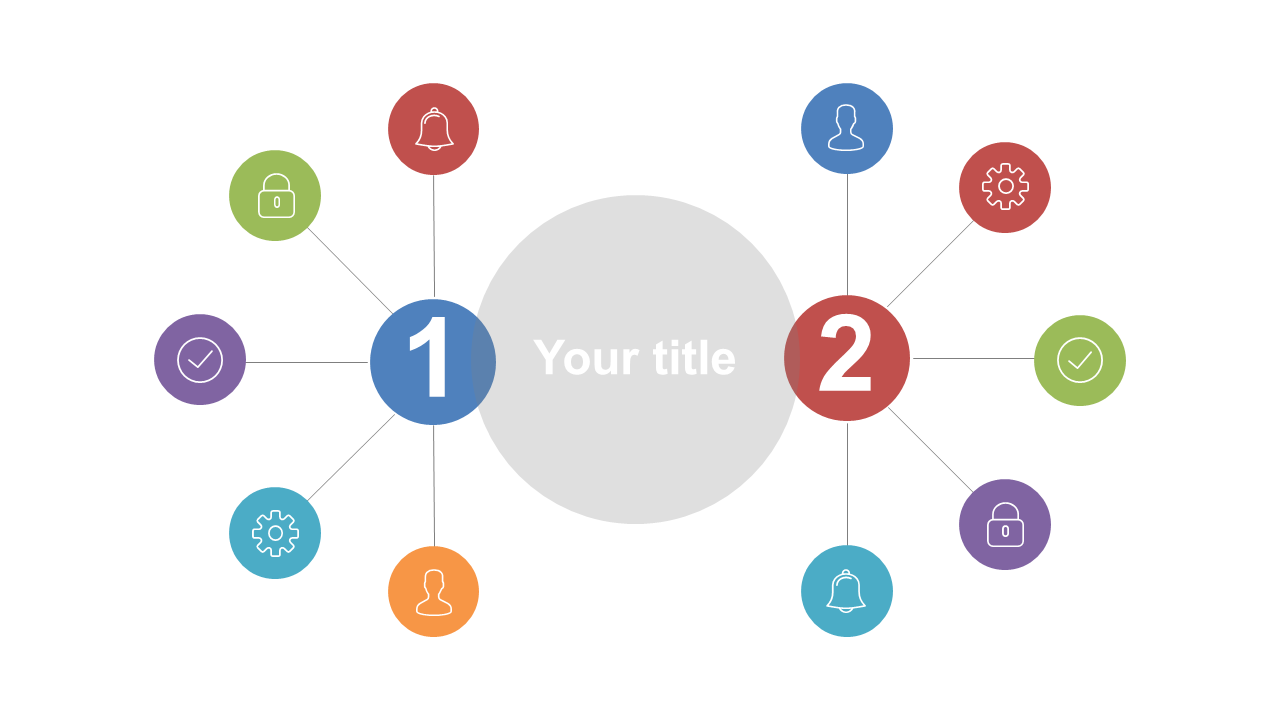
When data becomes intricate, visualizing relationships effectively can be quite the hurdle. If you’re confronting the challenge of making complex concepts understandable, this Connected Nodes Design slide can help.
It presents a central idea surrounded by interlinked elements, providing a straightforward way to clarify even the most complicated information. This design is perfect for data analysts, research specialists, and educators who need to illustrate relationships in their findings. You can use it in presentations, lectures, or reports to enhance your audience’s understanding and engagement with your material.
For only $0.99, this slide is available for immediate download and can be easily edited in PowerPoint and Google Slides. Get started in no time, customizing it to fit your specific concepts and presentations.
$0.99 – Purchase Checkout
Added to cart







