Present Processes with Colorful Steps and Icons
Product Description
When you’re explaining processes, it’s crucial that your audience can easily follow along. A busy presentation can leave your viewers lost, missing out on key information.
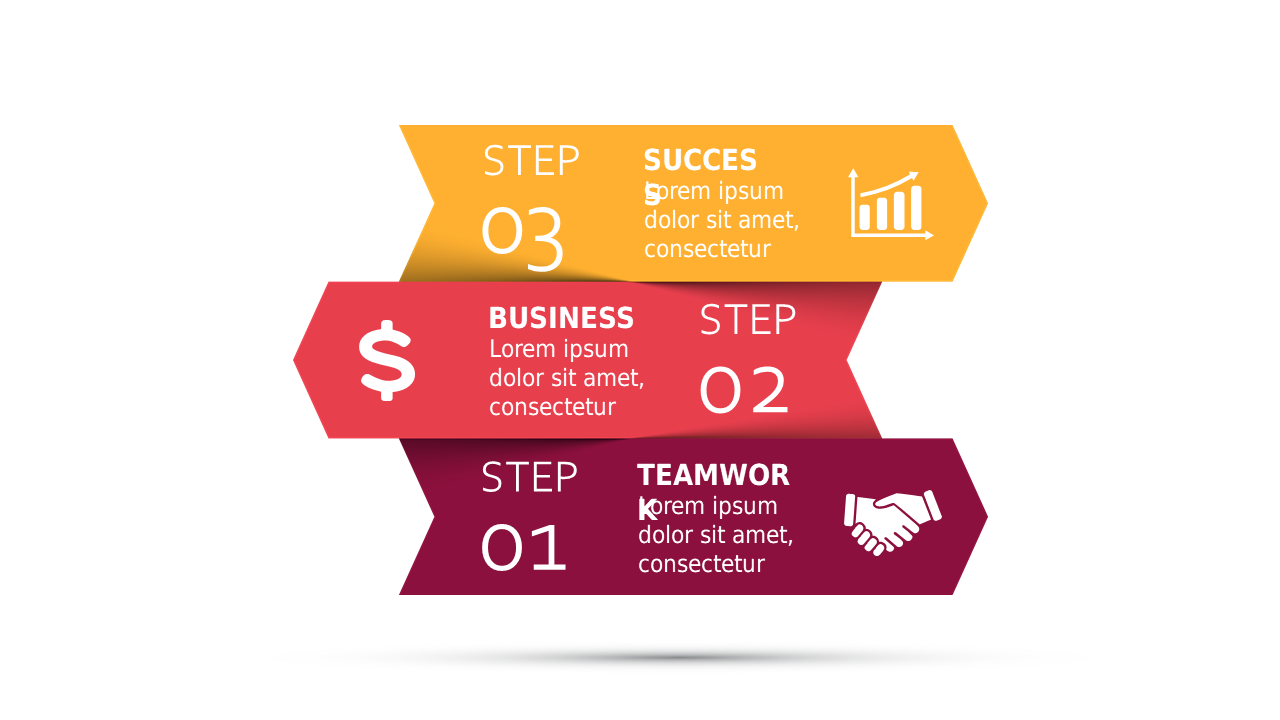
This vibrant slide lays out the steps clearly with distinct icons, making it straightforward for your audience to track the process you’re discussing. Use this slide when you’re a business analyst explaining workflow processes, a trainer guiding new employees through procedures, or a consultant presenting operational changes. This clear visual format is ideal for team meetings, training sessions, or client presentations, helping everyone stay aligned.
For just $0.99, you’ll receive an immediate download that you can easily edit in PowerPoint and Google Slides. Get ready to enhance your presentations within minutes!
$0.99 – Purchase Checkout
Added to cart







