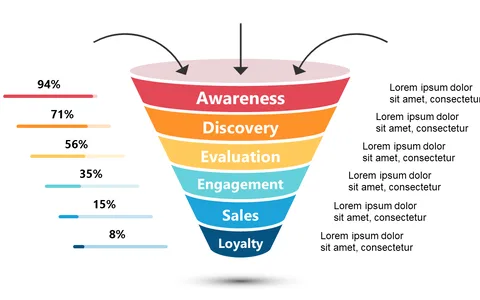
Illustrate Buyer Journey with Stages and Icons

Product Description
Communicating the complexities of the buyer’s journey can often lead to confusion and disengagement. Without a clear visual representation, it’s easy for your audience to lose track of the various stages that lead to a conversion.
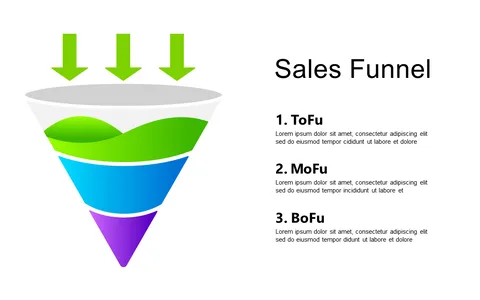
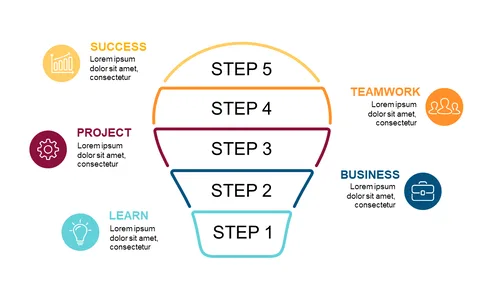
This slide breaks down those stages into easily digestible sections, making it simple for you to convey crucial milestones in the journey. Ideal for marketing professionals presenting campaign findings or product managers explaining customer insights, this slide can be used in workshops, webinars, or pitch meetings. It’s particularly suited for sectors like e-commerce, healthcare, or any field where understanding the buyer’s journey is vital for success.
You can grab this slide for just $0.99, and it’s ready for immediate download. It’s fully editable in PowerPoint and Google Slides, allowing you to customize the visuals to fit your style in a matter of minutes.
$0.99 – Purchase Checkout
Added to cart