Visual Process Steps with Colorful Icons
Product Description
Presenting complex processes can often leave your audience confused and disengaged. If you’ve struggled to convey intricate workflows in a way that resonates, this slide is your solution.
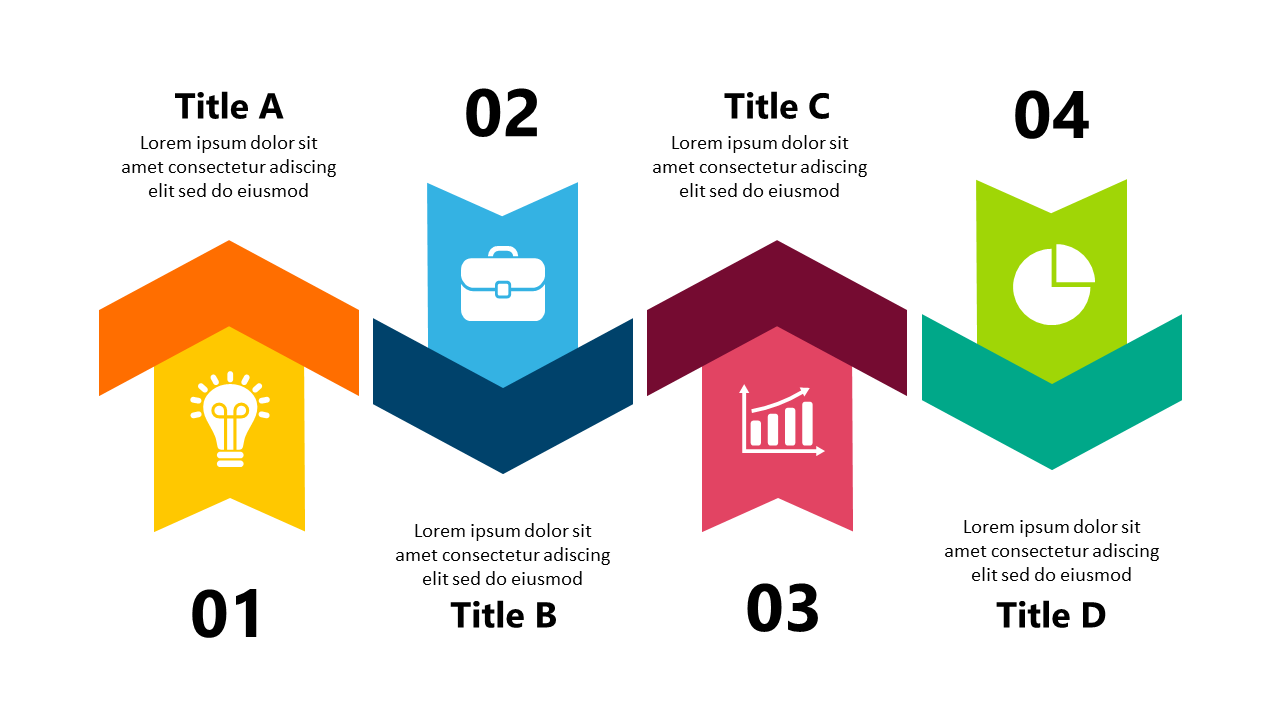
With colorful icons arranged in pointed banners, you can break down your process steps visually and make it easier for your audience to follow along. This slide is perfect for project managers walking teams through new initiatives, operations specialists outlining workflows, or marketing professionals explaining the customer journey. Whether you’re leading a training session, a status update, or a strategic planning meeting, you’ll find this visual layout keeps your audience engaged and informed.
At just $0.99, this slide is an instant download that’s ready for you in minutes. You can easily edit it in PowerPoint or Google Slides, allowing you to customize the content to fit your unique needs quickly.
$0.99 – Purchase Checkout
Added to cart







