Engaging Gears Layout for Project Management Overview
Product Description
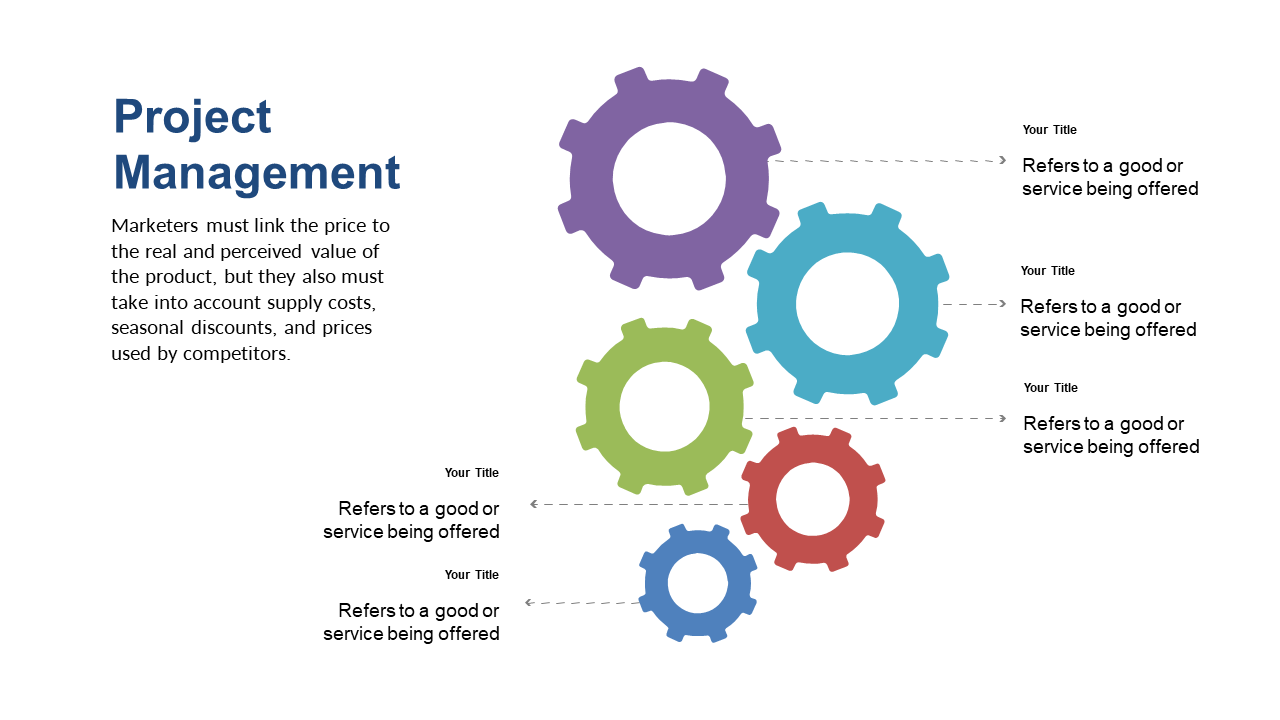
Translating the complexity of project management into a clear, understandable format can be a challenge, especially when trying to illustrate how different components interconnect. With this engaging gears layout, you can effectively communicate the relationships and dependencies between various elements, making your message much clearer for your audience.
This slide is ideal for team leads and project coordinators in tech startups or large corporations, especially during project review meetings or brainstorming sessions. Use it to walk your team through project phases, highlight critical interdependencies, or even in training sessions to explain how processes fit together.
For just $0.99, you can download this slide instantly and edit it in both PowerPoint and Google Slides. It’s immediately ready for you to personalize, ensuring you can make your presentation shine in no time.
$0.99 – Purchase Checkout
Added to cart