Customizable Colorful Gears for Project Management
Product Description
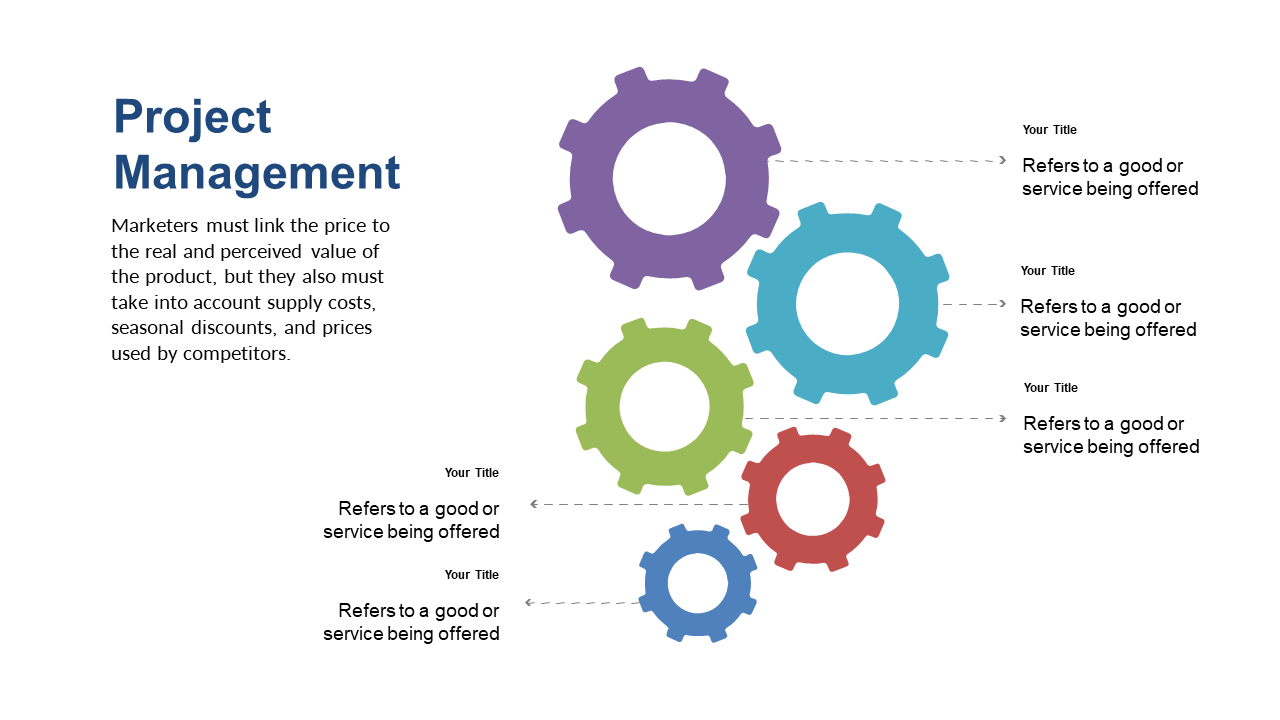
Complex relationships in project management deserve a visual representation that captivates your audience. This colorful slide featuring interlocking gears effectively illustrates the connections between different project components, making it easier for you to convey crucial information during your presentations.
As a project manager in fields like software development or product design, this slide can come in handy during project planning meetings, where you need to explain how various tasks are interrelated. It’s also useful for client presentations or stakeholder updates, ensuring everyone understands how pieces fit together to achieve project goals.
You can grab this slide for only $0.99, and with an instant download, you’ll have it ready in PowerPoint or Google Slides. It’s simple to edit and adjust, allowing you to customize it to match your project’s unique needs.
$0.99 – Purchase Checkout
Added to cart