Highlight Key Concepts with Colorful Cylinders

Product Description
Complex ideas can often leave your audience confused or disengaged, which is the last thing you want during an important presentation. Bright visuals are one of the best ways to simplify your messages and make them more relatable.
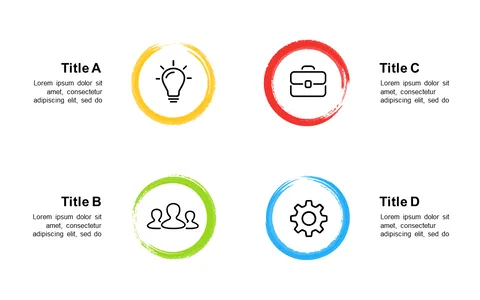
This slide with colorful cylinder icons effectively highlights various key concepts, ensuring that your audience stays focused and understands your points clearly. Whether you’re a product manager explaining features during a sprint review, an educator giving a lecture, or a business analyst presenting market data, this slide will serve you well. The vibrant colors and neat layout help maintain interest, making it ideal for workshops, training sessions, or client meetings where clarity is essential.
For just $0.99, you can download this slide and start using it right away. It’s fully editable in both PowerPoint and Google Slides, making it simple to tailor it to your specific topics and needs.
$0.99 – Purchase Checkout
Added to cart