Outline Project Steps with Colorful Circles
Product Description
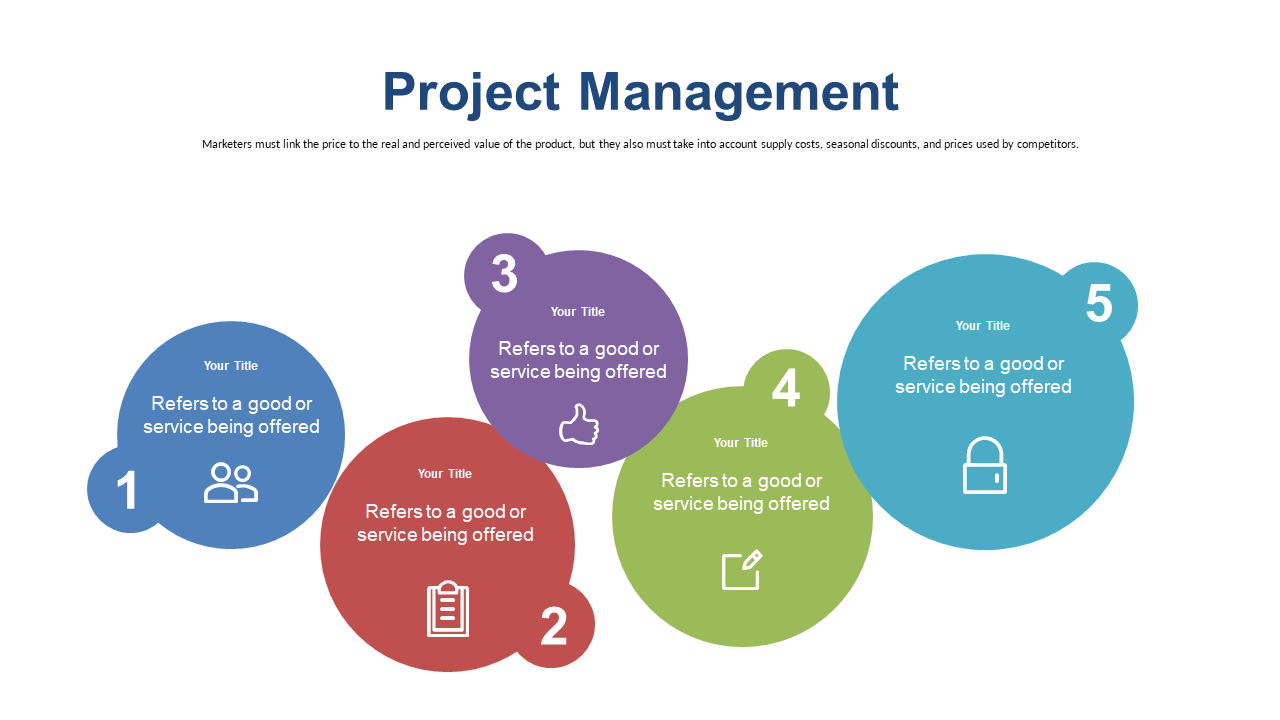
When outlining project steps for your team, ensuring clarity is essential to avoid misunderstandings. This slide uses colorful circles to represent different phases, making complex information easy to digest and enabling everyone to stay aligned.
Project leads, scrum masters, and product owners can utilize this slide during sprint planning or team alignment meetings. It’s particularly effective in fast-paced environments where visual representation aids in better comprehension and engagement.
For only $0.99, this editable slide is available for instant download. You can quickly adjust it in PowerPoint or Google Slides to suit your specific needs, helping you present your project steps with confidence.
$0.99 – Purchase Checkout
Added to cart







