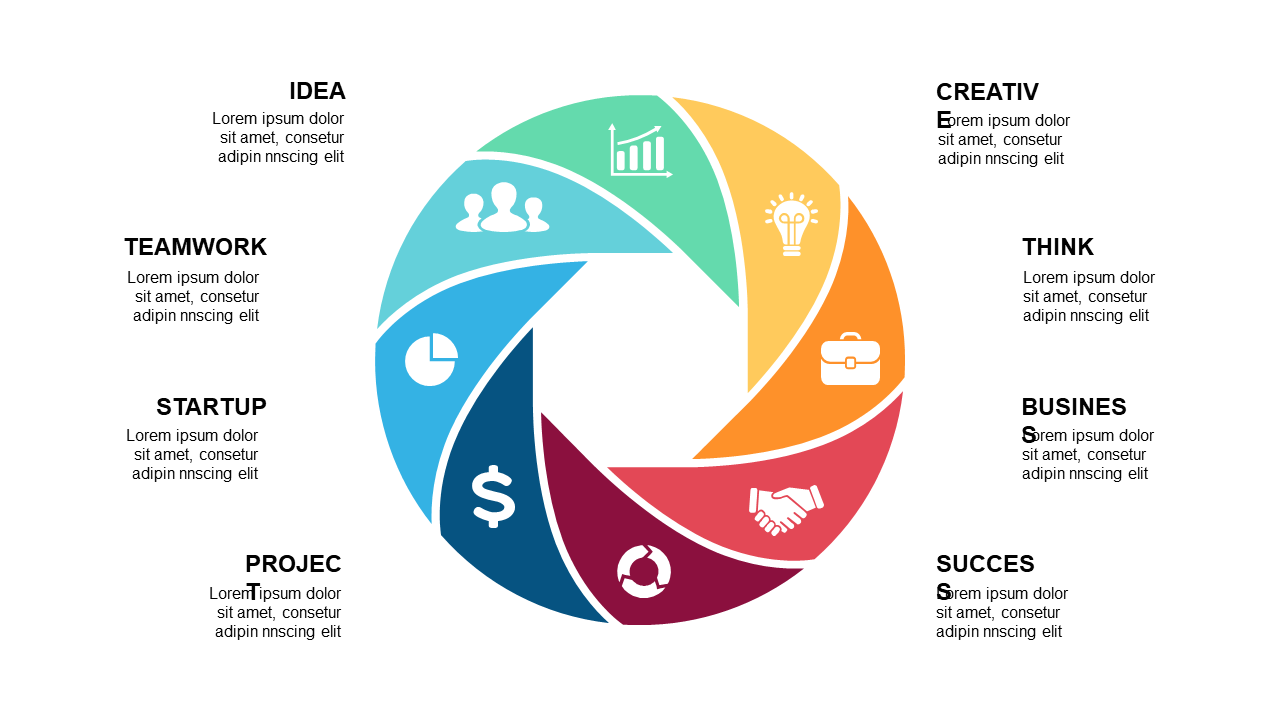
Illustrate Cyclical Processes with 8-Segment Diagram
Product Description
Visualizing cyclical processes can be a challenge, especially when trying to convey multiple steps or phases in a clear manner. This 8-segment diagram allows you to break down complex strategies into digestible parts, enabling better understanding and retention.
It turns abstract ideas into a format that’s easy to grasp. Ideal for operations managers discussing continuous improvement processes or product development teams outlining iterative workflows, this slide is versatile for any business context. It’s perfect for project updates or strategic planning sessions where clarity in progress can make all the difference in decision-making.
For just $0.99, you can download this eye-catching diagram instantly and customize it to your liking in PowerPoint or Google Slides. With easy editing options, you can adjust colors, icons, and text to perfectly fit your specific scenario.
$0.99 – Purchase Checkout
Added to cart







