Represent Business Concepts with Circular Icons V4

Product Description
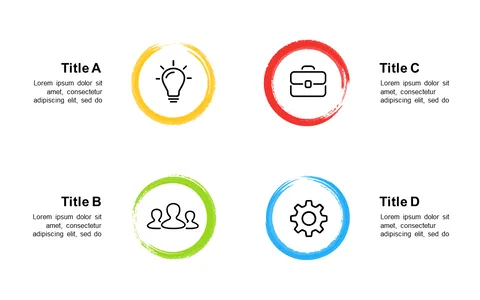
If you’ve ever struggled to explain a complex business idea clearly, you know how frustrating it can be to find the right visuals. This slide helps bridge that gap by offering a set of colorful circular icons that simplify your concepts, making them more relatable and easier to understand. It turns abstract ideas into engaging visuals that your audience will appreciate.
This slide is perfect for project managers drafting proposals or reports, marketing professionals creating presentations for product launches, or financial analysts summarizing quarterly results. It serves well in team meetings or client briefings, where clarity and visual engagement are critical. By incorporating these icons, you’ll enhance your presentations and keep your audience focused.
For just $0.99, you can download this slide and start editing it immediately in PowerPoint or Google Slides. It’s designed to be user-friendly, making it simple for you to customize the icons to fit your specific needs. You’ll have a polished presentation ready in minutes!
$0.99 – Purchase Checkout
Added to cart