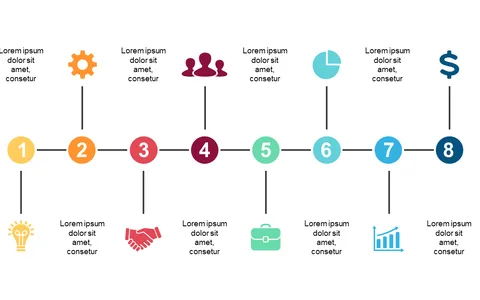
Visualize Step-by-Step Processes with Brush Stroke Design

Product Description
When it comes to explaining step-by-step processes, a clear visual presentation can make all the difference. This brush stroke design not only enhances the aesthetic but also breaks down complex workflows into easily digestible parts, helping your audience follow along without getting lost.
Product managers in tech companies or operations managers in manufacturing can benefit from this slide during team meetings or project kickoff presentations. By visually outlining each step, you’ll keep everyone on the same page and increase engagement.
At just $0.99, you can download this slide instantly. It’s fully editable in PowerPoint and Google Slides, so
you can customize it to suit your specific needs in just minutes.
$0.99 – Purchase Checkout
Added to cart