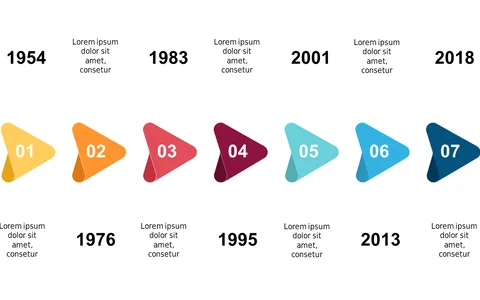
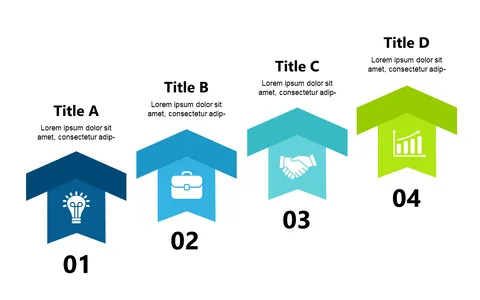
Visualize Growth with Colorful Arrow Steps

Product Description
Illustrating growth can be a daunting task, especially when your audience is pressed for time. This slide brings your metrics to life with colorful, ascending arrows that make understanding progress a breeze. It transforms abstract numbers into a visual journey everyone can follow.
Marketing managers, sales teams, and product developers will find this slide indispensable during quarterly reviews or growth strategy sessions. Whether you’re showcasing sales increases or project milestones, its lively design ensures important information is communicated effectively without overwhelming your audience.
At just $0.99, this slide is an instant download that
you can customize effortlessly in PowerPoint or Google Slides. It’s user-friendly and will have you ready to impress your audience in no time at all.
$0.99 – Purchase Checkout
Added to cart