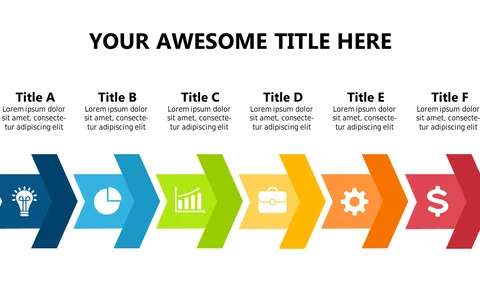
Present Sequential Steps with Colorful Arrows

Product Description
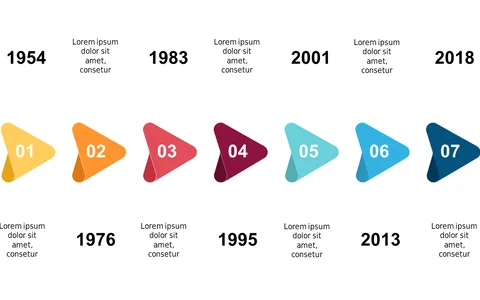
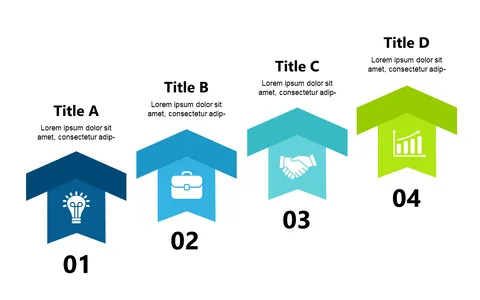
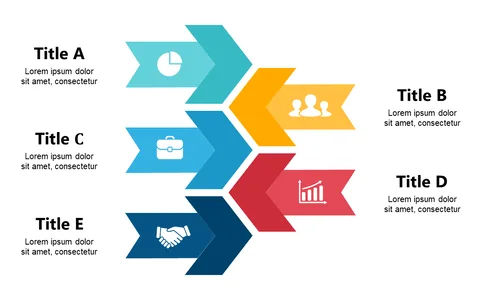
Presenting complex project timelines can often leave your audience confused about the sequence of steps involved. This slide helps you break down intricate processes into manageable visuals, using colorful arrows to guide viewers from one phase to the next with ease.
This slide is perfect for project managers preparing for weekly updates, team leaders conducting sprint reviews, or operations professionals explaining workflows. The clear design allows you to effectively communicate your strategy during team meetings or planning sessions, ensuring everyone is aligned.
For just $0.99, you can instantly download this slide, which is fully editable in both PowerPoint and Google Slides. Make your presentations pop and engage your audience with a simple click!
$0.99 – Purchase Checkout
Added to cart