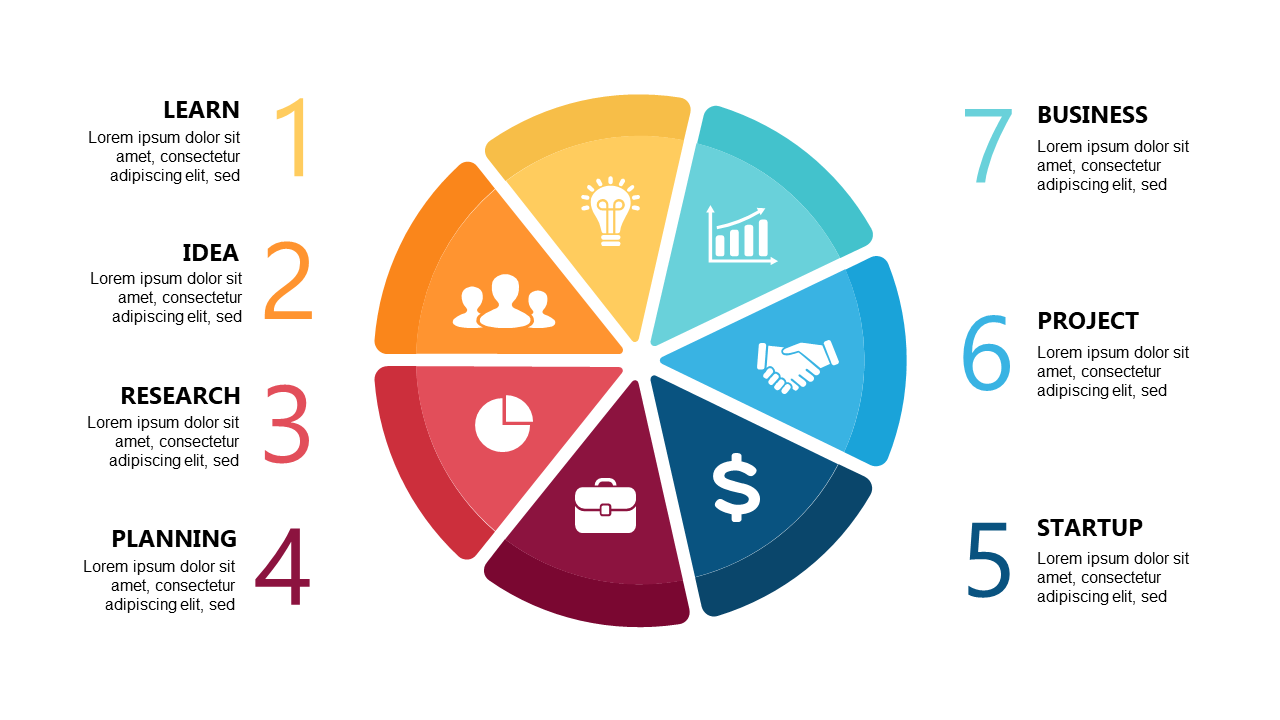
Visualize Steps with Colorful 6-Segment Process Diagram
Product Description
When you’re tasked with conveying a multi-step process, clarity is vital. This vibrant 6-segment process diagram is designed to make each step stand out, helping your audience follow along effortlessly. The bright colors and clear divisions allow for quick understanding and retention of information, making it an excellent choice for any PowerPoint presentation.
As an operations manager, you can use this slide to outline key workflow efficiencies during team meetings or training sessions. For a project manager, it serves as a visual aid to demonstrate project phases and timelines effectively. Meanwhile, as a business analyst, you can break down complex data processes into digestible steps that promote better decision-making.
Customization is simple; just replace the wording and icons to fit your specific topic. This slide is not just a tool; it’s a way to communicate your ideas clearly and effectively.
$0.99 —
add this single slide to any deck from the SlideSwift Slide Library. No subscription needed. Mix slides from any category to build your perfect deck.
$0.99 – Purchase Checkout
Added to cart







