Showcase Strategies with Circular Strategy Map

Product Description
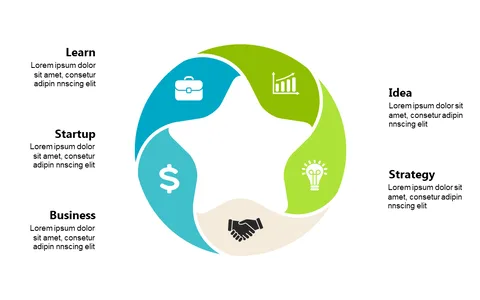
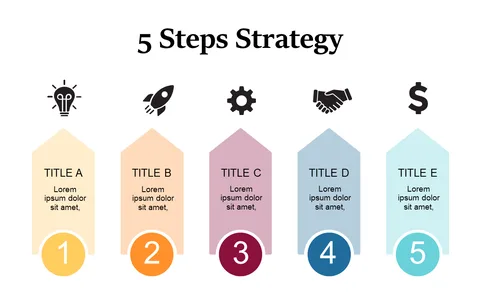
Complex strategies often leave your audience scratching their heads. When you need to illustrate the relationships between various components clearly, this circular strategy map serves as a visual aid that cuts through potential confusion, allowing everyone to follow along easily.
This slide works wonders for project managers detailing project timelines, product owners presenting roadmaps, or business analysts discussing market strategies. It’s ideal for team syncs, client presentations, or strategy workshops where clarity is crucial for team alignment.
Available for only $0.99, this slide is ready for instant download and quick editing. You can modify it in PowerPoint or Google Slides to match your own brand and messaging, so you’ll be presentation-ready in no time.
$0.99 – Purchase Checkout
Added to cart