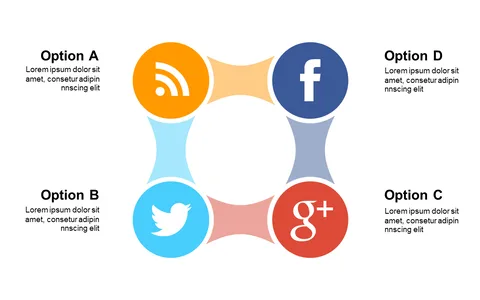
Visualize Phases in a Circular Puzzle Format

Product Description
Presenting intricate processes can often lead to confusion and disengagement. You need a way to simplify complex ideas without losing your audience’s interest.
This circular puzzle format gives you the visual clarity required to show how different phases connect and interact with each other. This slide is perfect for project managers leading cross-functional teams or business analysts presenting workflow processes. Whether you’re sharing a project timeline in a team meeting or explaining interconnected sales strategies in a boardroom, this visual tool will help your audience grasp the information more effectively.
For just $0.99, you can instantly download this slide and make it your own. It’s fully editable in PowerPoint and Google Slides, allowing you to customize the text to fit your specific needs in just minutes.
$0.99 – Purchase Checkout
Added to cart