Visualize Ideas with Circular Puzzle Design

Product Description
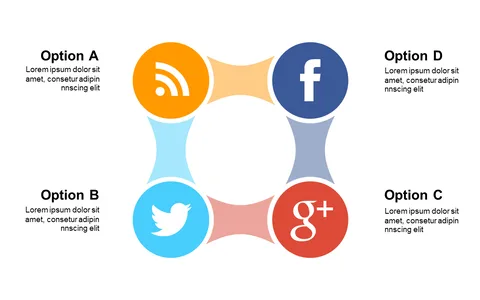
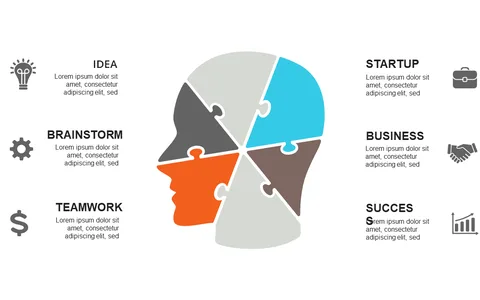
Trying to visualize interconnected ideas can feel overwhelming, particularly when numerous phases or concepts are involved. A traditional layout doesn’t always capture the essence of those relationships. With this circular puzzle design, you can present your information creatively while maintaining easy-to-understand clarity.
This slide is great for business analysts presenting findings to stakeholders or team leaders discussing project timelines. Educators can also leverage it to teach complex subjects, allowing students to see the links between different ideas.
Nonprofit organizers can use it to illustrate their program models during community presentations, making their messages more memorable. For only $0.99, you can download this slide and start customizing it immediately. It’s easily editable in both PowerPoint and Google Slides, so you can have it ready for your next presentation in just a few minutes.
$0.99 – Purchase Checkout
Added to cart