Circular Project Life Cycle for Workflow Presentation
Product Description
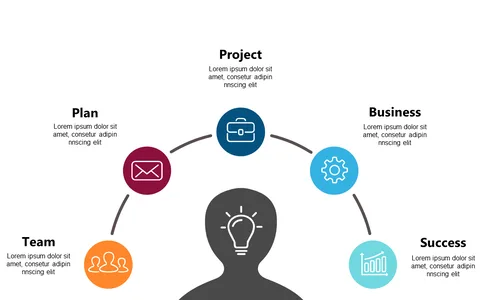
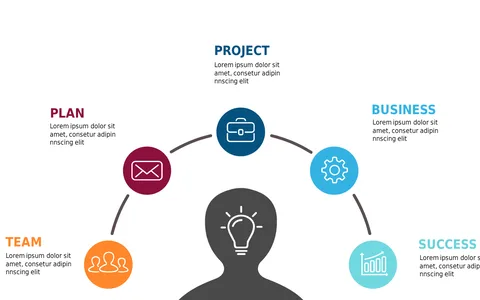
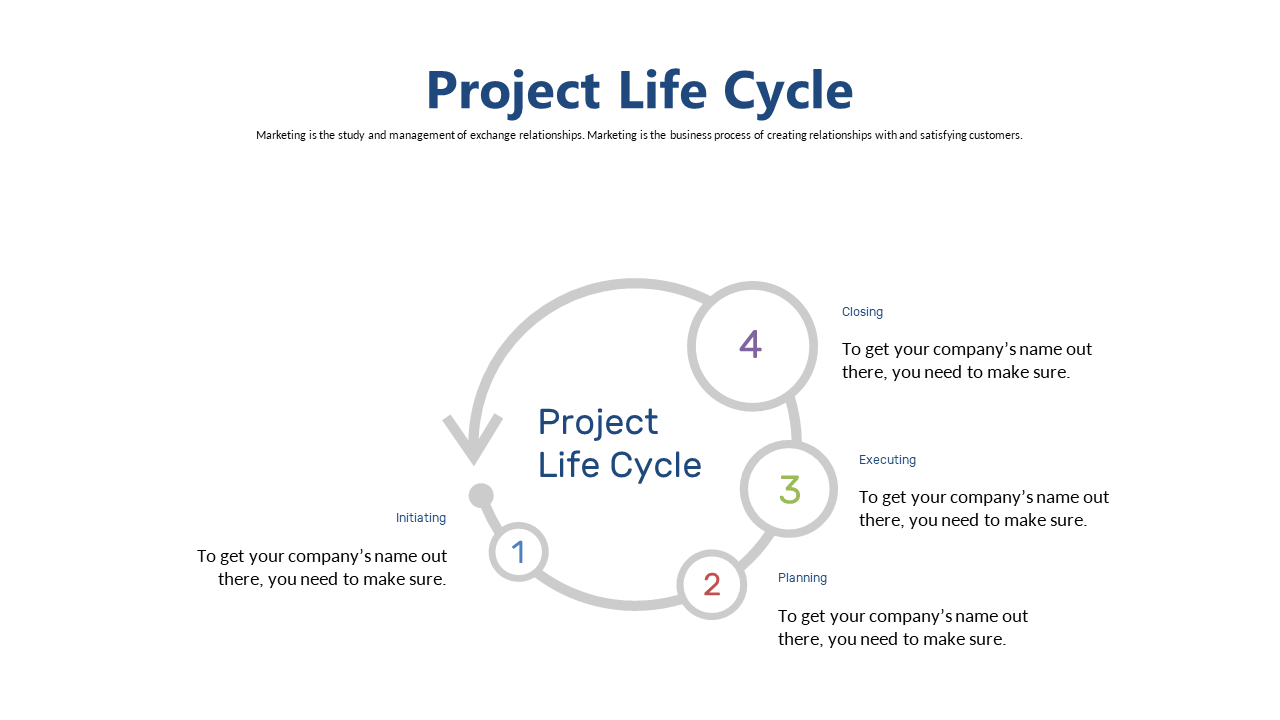
Communicating project workflows can be a real challenge, especially when juggling multiple projects at once. This circular slide effectively represents the life cycle phases, making it visually appealing and easy to understand.
With each stage clearly mapped out, you can help your audience follow along without getting lost in the details. This slide is a great fit for program managers and business leaders who need to present updates on project progress in stakeholder meetings or strategy sessions. By showcasing Initiating, Planning, Executing, and Closing stages, you can make your project workflows transparent and easily digestible for everyone involved.
For just $0.99, this slide is available for instant download and can be edited in PowerPoint or Google Slides. Enhance your project presentations and make complex information accessible in minutes!
$0.99 – Purchase Checkout
Added to cart