Circular Diagram for Workflow Steps
Product Description
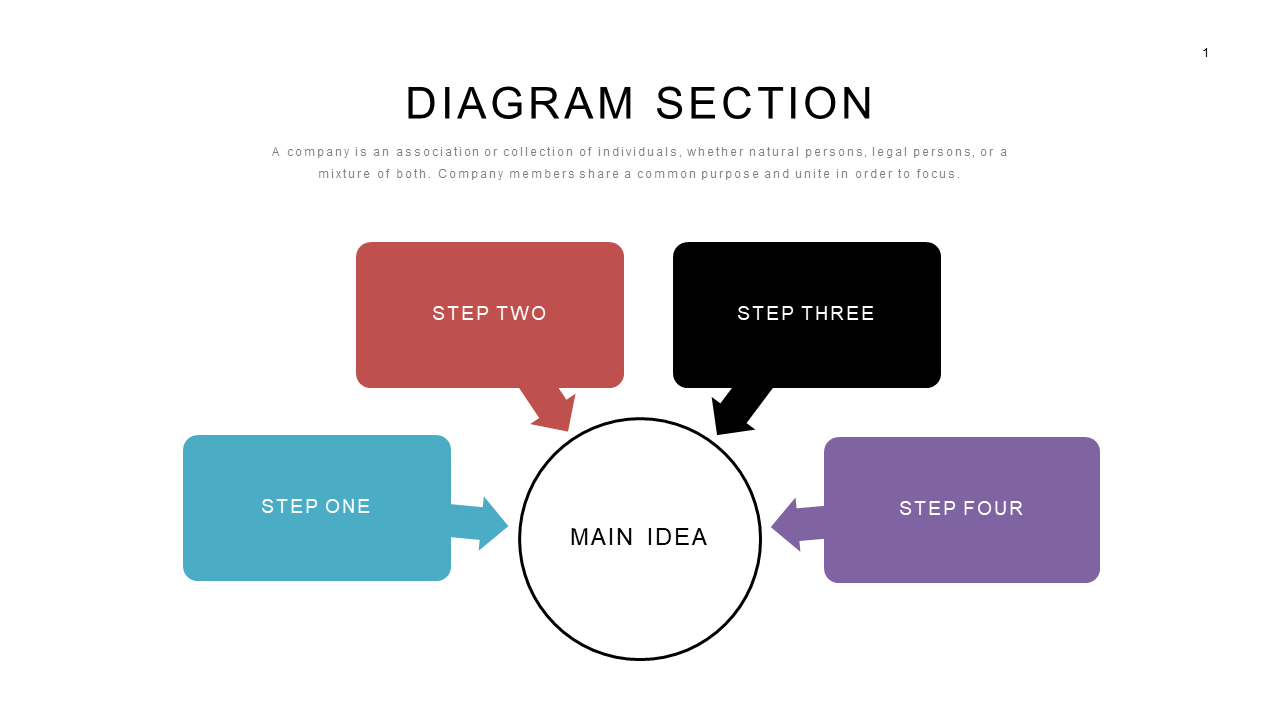
Conveying complex workflows can feel like a monumental task when you have multiple steps to explain. This circular diagram simplifies that challenge by visually breaking down each phase of the process.
You can focus on engaging your audience instead of worrying about clarity. Business analysts, project coordinators, and operations managers will find this diagram particularly helpful in team meetings, training sessions, or process improvement workshops. It effectively highlights the main idea while clearly illustrating the sequential steps involved, making it easier for everyone to follow along.
For only $0.99, this slide is available for instant download and can be easily modified in PowerPoint or Google Slides. Get started on your workflow presentation today and impress your audience with clear visuals.
$0.99 – Purchase Checkout
Added to cart







