Engage Audiences with Circular Process Diagram Style
Product Description
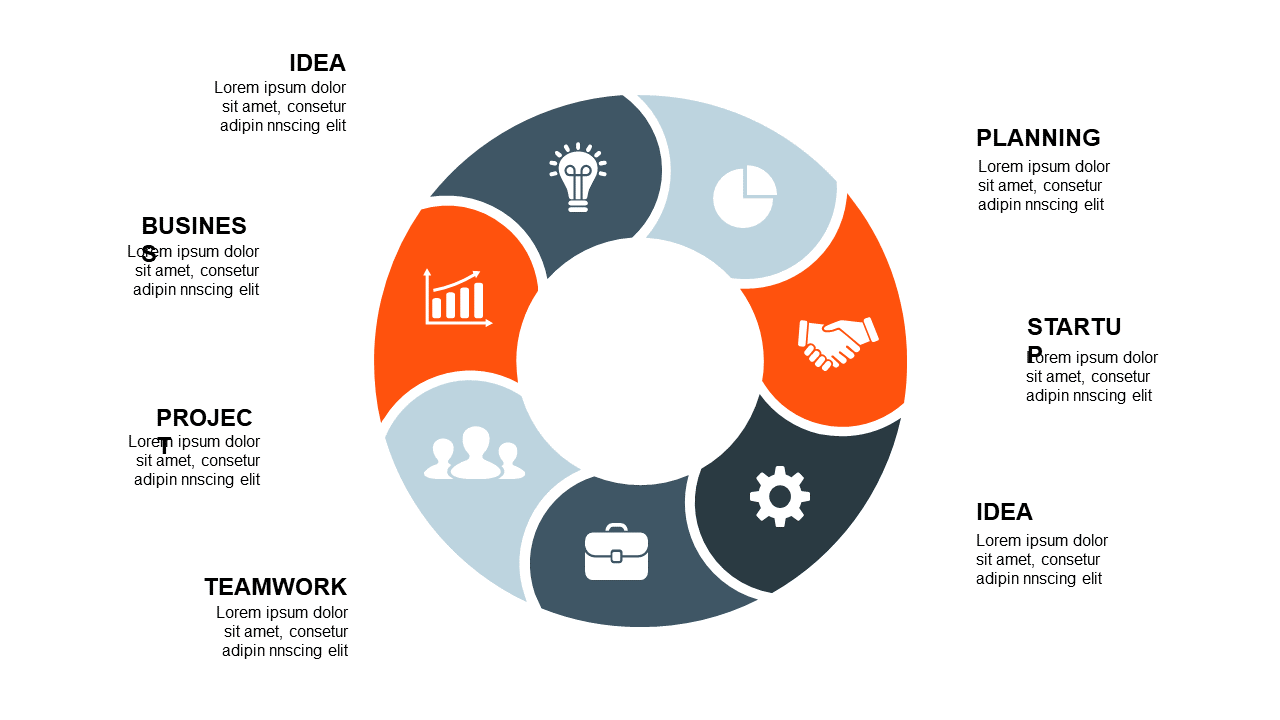
Keeping your audience engaged while conveying complex information can feel like an uphill battle. If your presentation isn’t visually appealing, you risk losing their focus and failing to communicate your message. This circular process diagram style helps break down intricate workflows into manageable segments, making your content relatable.
This slide works well for business analysts presenting process improvements or for team leaders during project kick-off meetings. It’s also effective for trainers conducting workshops, where complex topics need to be simplified for better understanding.
Each section is distinct, allowing for a clean presentation of each part of the process. For only $0.99, you can download this engaging slide instantly and edit it in PowerPoint or Google Slides. The easy customization means you can have your presentation ready to go in just minutes.
$0.99 – Purchase Checkout
Added to cart







