Visualize Pricing Strategies with Circular Market Value Diagram
Product Description
Articulating pricing strategies in a way that resonates with your audience can be challenging. You want to ensure that your pricing decisions come across clearly, but traditional methods often fall short.
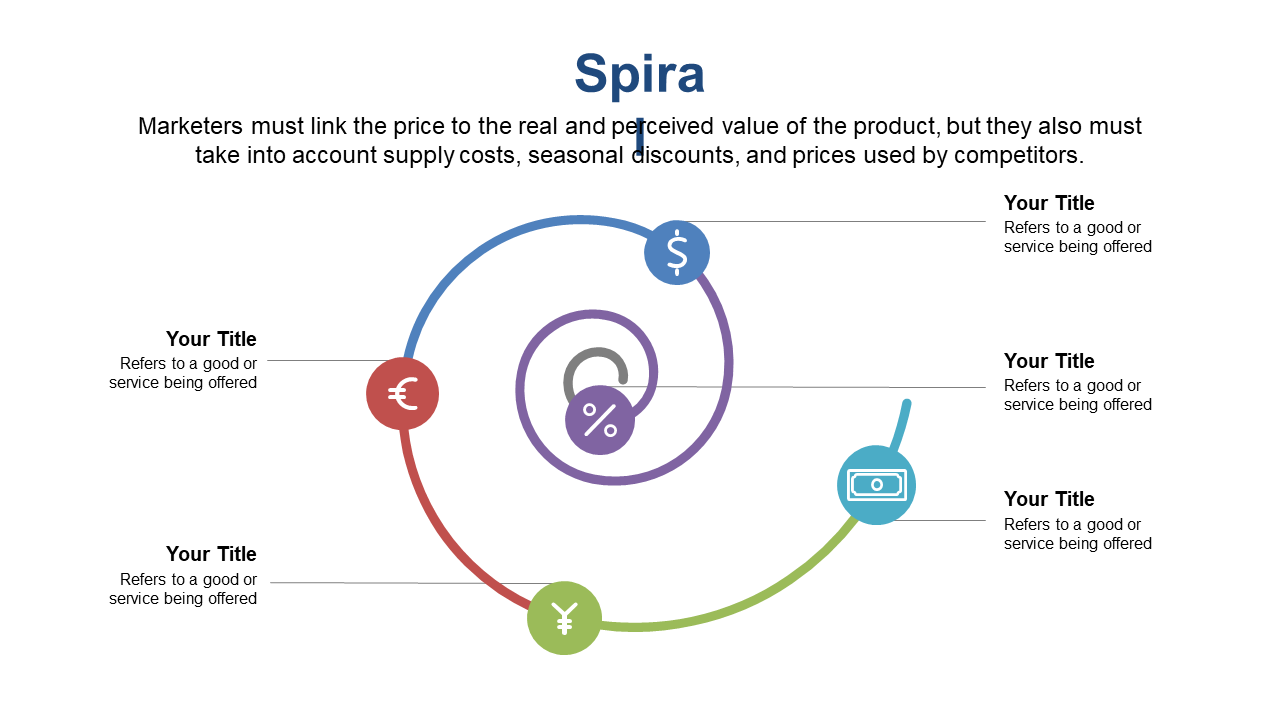
This circular market value diagram simplifies that process, allowing you to visually represent your pricing structure effectively. This slide is ideal for product managers, financial analysts, and marketing directors involved in pricing discussions, especially during quarterly reviews or strategic planning sessions. Use it to clarify complex pricing models in team meetings or client presentations, ensuring everyone understands the value behind your numbers.
For only $0.99, this slide is ready for instant download and can be easily modified in both PowerPoint and Google Slides. Get it now to communicate your pricing strategy with clarity and confidence in no time.
$0.99 – Purchase Checkout
Added to cart







