Visualize Strategies with Circular Multi-Phase Diagram
Product Description
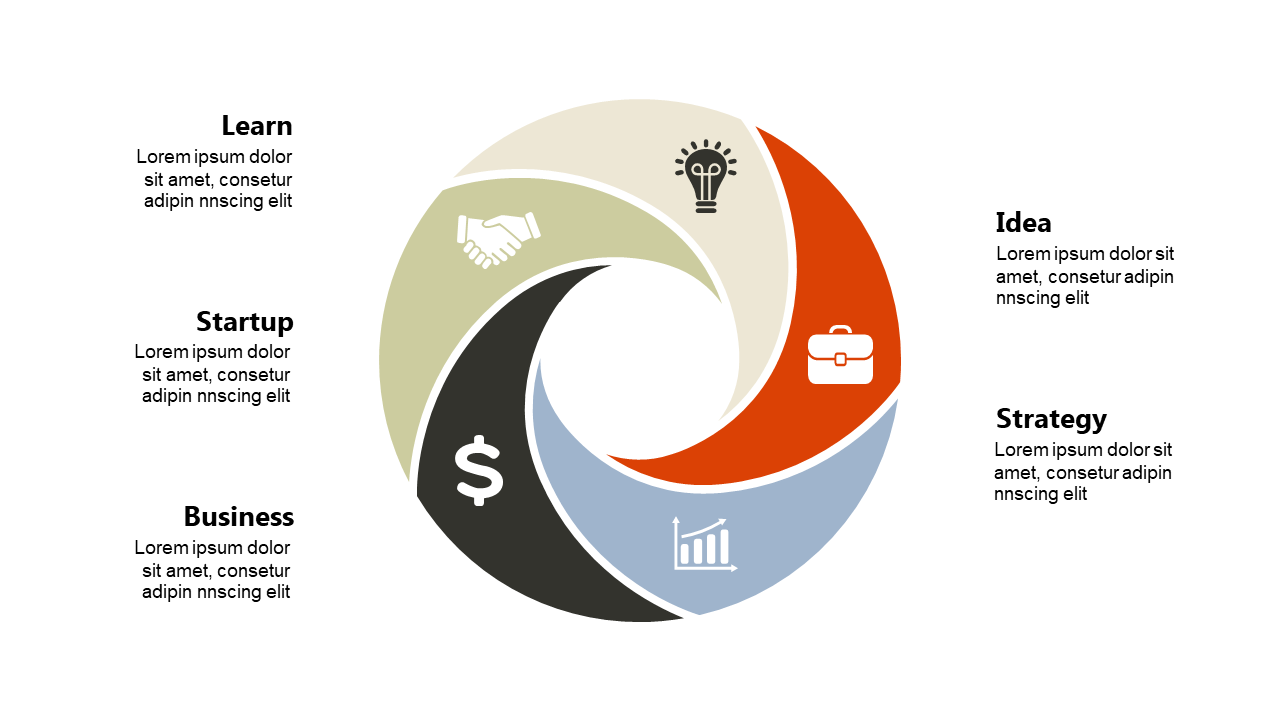
Clarifying intricate strategies for your audience can make or break an important presentation. Without a clear visual representation, your audience might get lost in the details. This circular multi-phase diagram simplifies complex strategies, offering a structured way to communicate each part of your process effectively.
This slide is ideal for strategic planners discussing business growth tactics or sales managers outlining their quarterly goals. It can also be used by financial analysts presenting investment strategies or by HR professionals explaining talent development programs.
Its straightforward design allows your audience to easily grasp the material being presented. Available for just $0.99, you can download this slide instantly. It’s easy to edit in PowerPoint and Google Slides, so you can adapt it to your needs in no time at all.
$0.99 – Purchase Checkout
Added to cart







