Present Market Segments with Circular Analysis
Product Description
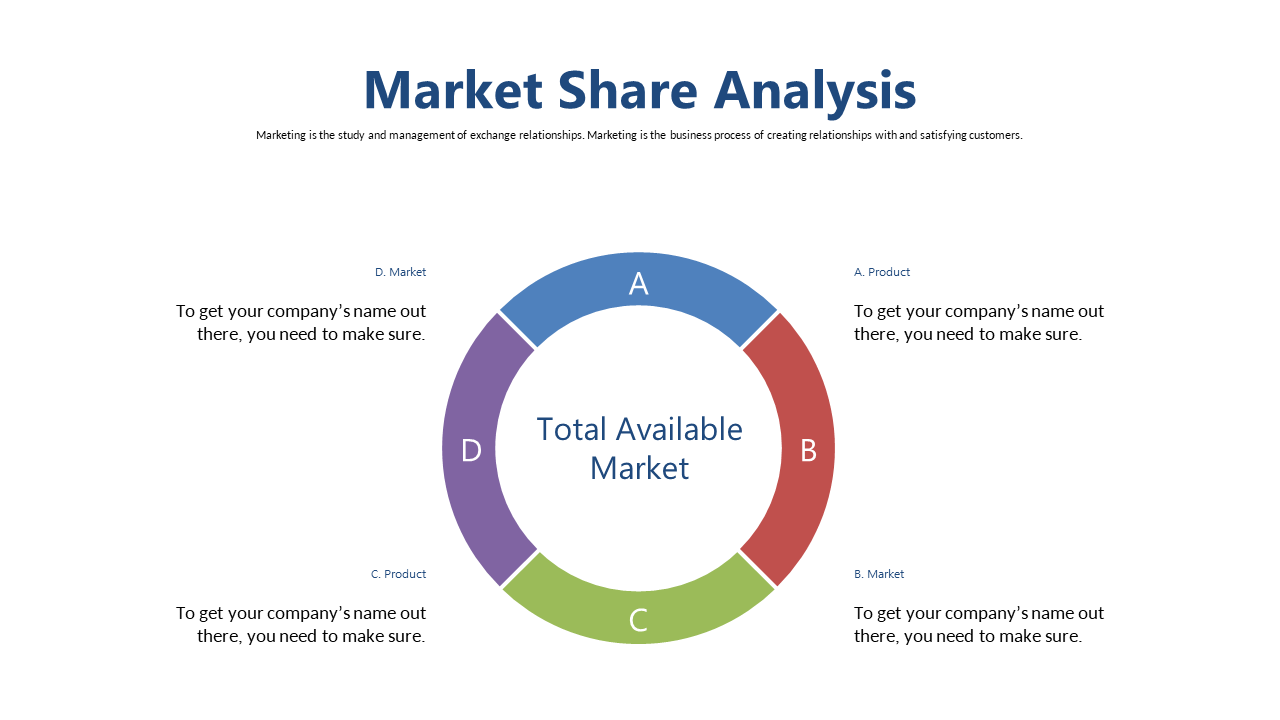
When you’re faced with the task of presenting multifaceted market data, clarity is key. A circular analysis diagram can make all the difference by clearly delineating various market segments, allowing your audience to absorb crucial insights quickly. This visual cuts through the clutter to deliver information in a straightforward way.
This slide is perfect for market analysts preparing reports or business development directors outlining market opportunities. If you’re leading a training session or making the case for a new venture, this diagram will help your audience understand the market landscape at a glance, facilitating better decision-making.
At just $0.99, this slide is available for instant download and can be easily edited in PowerPoint or Google Slides.
You can customize it to fit your specific data, ensuring that your presentation is not only informative but also visually appealing.
$0.99 – Purchase Checkout
Added to cart







