Visualize Market Relationships with Circular Diagram
Product Description
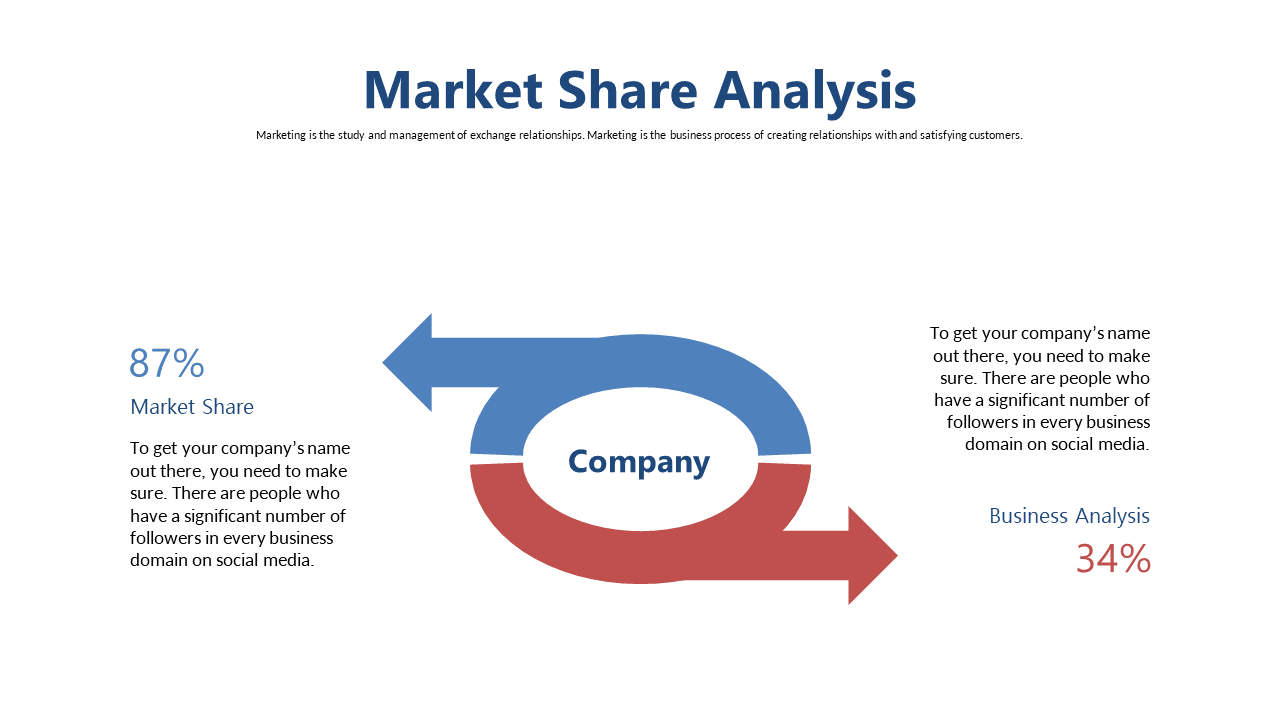
Navigating the intricate relationships within market segments can be quite challenging, especially when trying to convey your findings to an audience. This circular diagram breaks down those complexities, providing a clear visual representation of market shares and their interconnections.
It helps make abstract concepts feel tangible and understandable. This slide is ideal for data analysts presenting market research findings or strategists collaborating on business models. If you’re giving a presentation at a trade conference or facilitating a team discussion, this diagram serves as a powerful tool to showcase how different segments relate to one another in the marketplace.
For only $0.99, you can download this slide instantly and edit it with ease in PowerPoint or Google Slides. Its straightforward format means you can quickly tailor it to your specific needs, helping you focus on what truly matters in your presentation.
$0.99 – Purchase Checkout
Added to cart







