Analyze Market Dynamics with Circular Diagram
Product Description
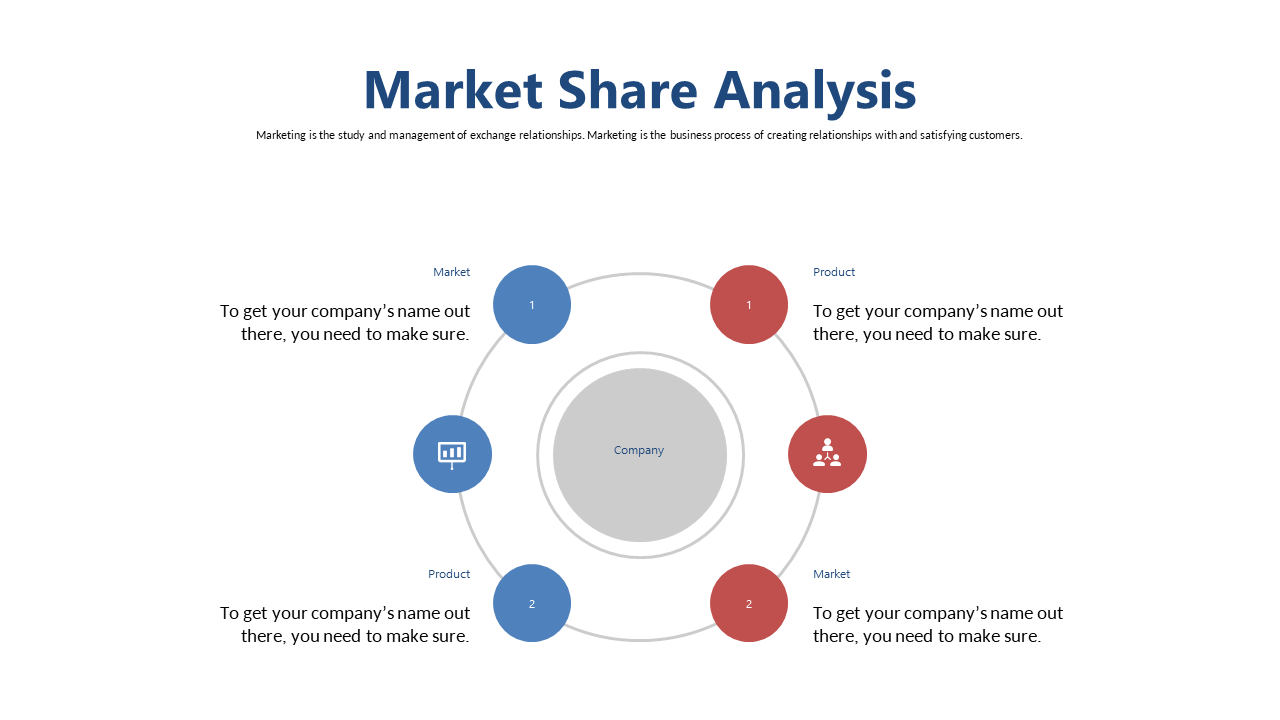
Understanding market dynamics can feel overwhelming, especially when trying to visualize multiple factors at play. You need a clear representation of how different elements influence market share, and that’s where this circular diagram comes in.
It allows you to present complex relationships in a straightforward manner, making your insights easier to grasp. This slide is perfect for product managers conducting competitive analysis or business analysts preparing market entry strategies. If you’re leading a workshop or presenting findings to upper management, having a visual like this can significantly enhance comprehension and facilitate discussion.
Available for just $0.99, this slide is ready for instant download and simple to edit in PowerPoint or Google Slides. You’ll be able to customize it quickly and efficiently, ensuring that your presentation is impactful and professional.
$0.99 – Purchase Checkout
Added to cart







