Enhance Presentations with Circular Icon Set

Product Description
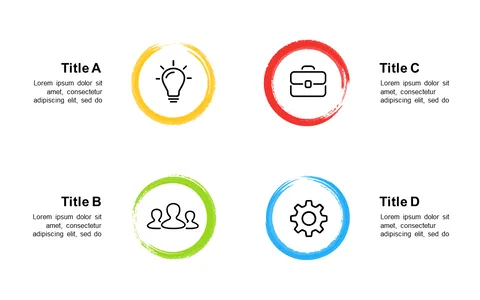
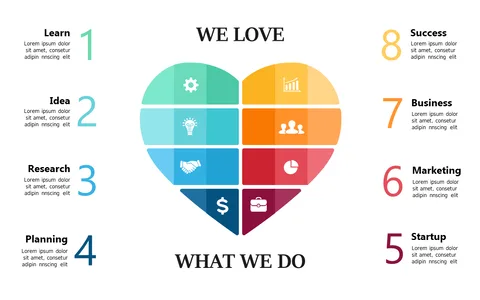
Summarizing complex concepts visually can be a challenge in any presentation, often leading to information overload. This circular icon set provides a clean and modern way to represent key business themes, helping your audience to digest important ideas without getting lost in too much text.
Perfect for consultants needing to illustrate innovation strategies, team leaders presenting productivity metrics, or analysts showcasing trend analyses in their reports, this slide can enhance your storytelling. It’s also great for marketing professionals outlining campaign highlights, providing clear visuals that anchor your discussion.
For just $0.99, download this slide and enjoy seamless editing in PowerPoint or Google Slides. Tailor each icon to your needs, and have your visual enhancements ready in minutes.
$0.99 – Purchase Checkout
Added to cart