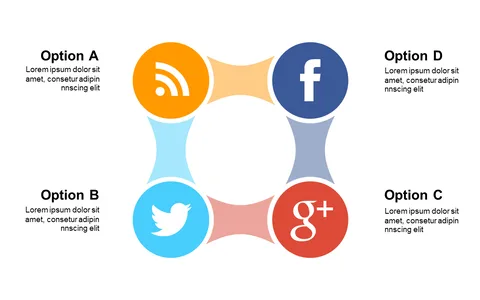
Showcase Eco-Innovation with a Circular Diagram

Product Description
Communicating eco-innovation can be a daunting task, especially with so many concepts to cover. This circular diagram helps you break down complex ideas into easily digestible segments, making it simple for your audience to grasp the core themes of sustainability and environmental progress.
Ideal for environmental consultants presenting to clients, educators teaching sustainability in schools, or team leaders sharing innovative eco-solutions in corporate meetings, this slide enables you to visually represent diverse eco-innovation concepts effectively. Whether you’re pitching a new green initiative or leading a discussion during a board meeting, this tool makes your message clear.
For just $0.99, you can instantly download this slide and start customizing it in PowerPoint or Google Slides. Change the icons, colors, and text to fit your needs, creating an engaging presentation that resonates with your audience in minutes.
$0.99 – Purchase Checkout
Added to cart