Connect Ideas with Circular Diagram for Strategies
Product Description
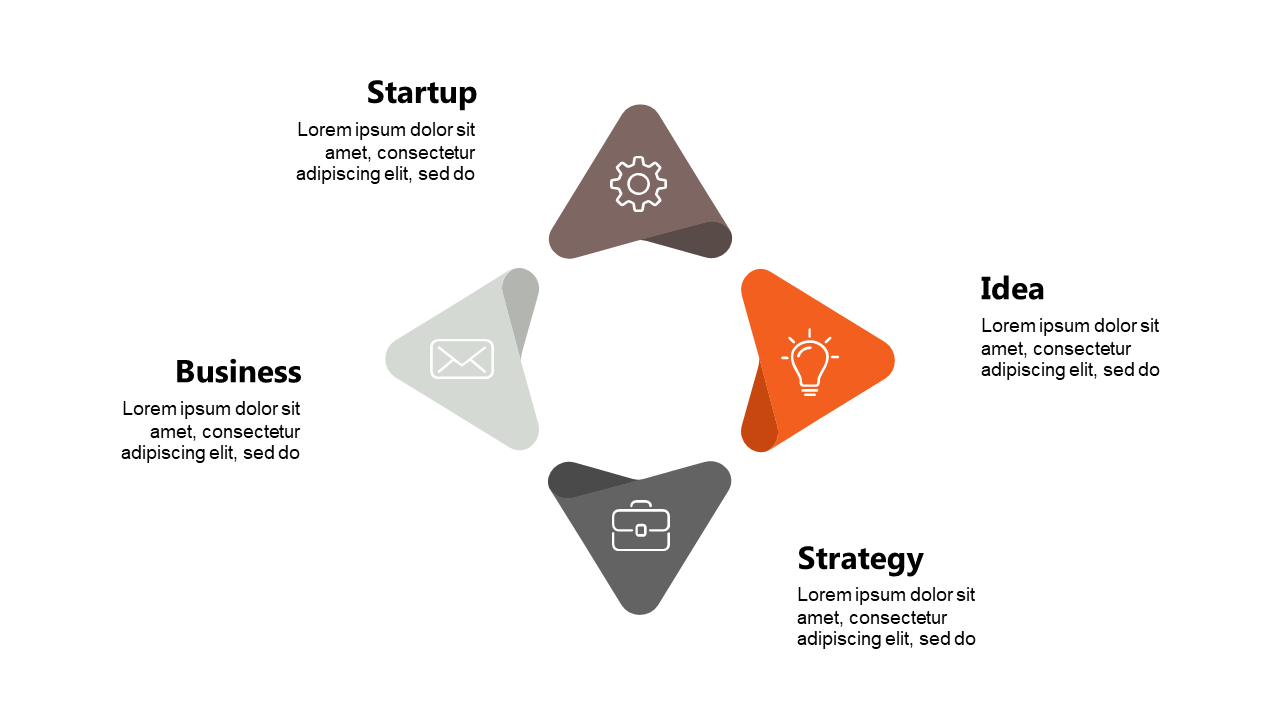
Communicating complex strategies can be a real challenge, especially when you want to make connections clear. This circular diagram effectively showcases how different concepts interrelate, helping your audience see the overall strategy without getting bogged down in details. It’s a visual solution to a common presentation hurdle.
Project managers across industries, from tech to finance, often need to discuss strategic connections in team meetings or status updates. This slide is perfect for those scenarios, allowing you to present your ideas cohesively and engagingly.
It turns abstract concepts into visual narratives that your audience can easily follow. For just $0.99, you can instantly download this slide and make it your own. It’s fully editable in both PowerPoint and Google Slides, ensuring you can tailor it to your specific context in just a few minutes.
$0.99 – Purchase Checkout
Added to cart