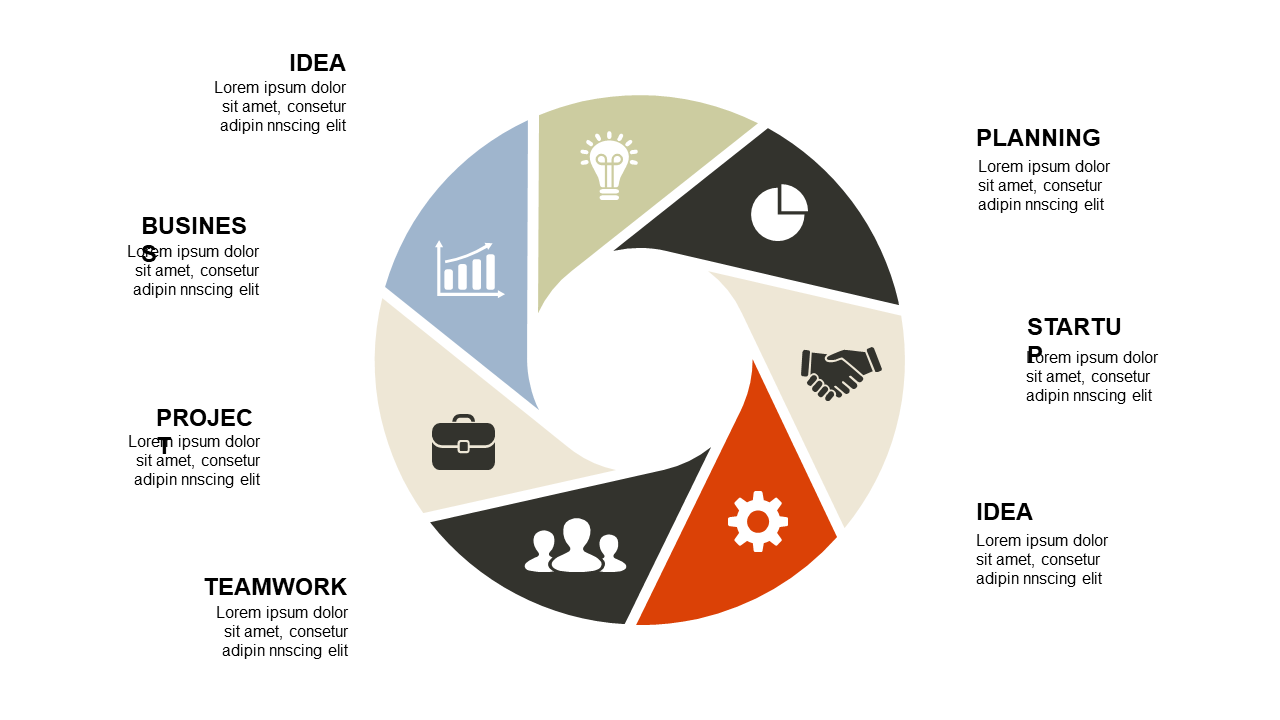
Represent Project Phases with 6-Step Circular Diagram
Product Description
Project phases can feel disjointed without a clear way to visually represent their flow and relationship. It’s easy for details to get lost in the shuffle when presenting to your team or stakeholders.
This circular 6-step process diagram organizes those phases into a cohesive visual, allowing everyone to see how each stage connects. Ideal for project managers, product developers, and team leads, this slide is perfect for use during project kickoffs or status updates. You’ll find it especially helpful in industries like tech, construction, or any field where structured project phases are crucial to success.
For just $0.99, you can download this slide instantly and make it your own. It’s fully editable in PowerPoint and Google Slides, so you can tailor it to your specific needs within minutes.
$0.99 – Purchase Checkout
Added to cart







