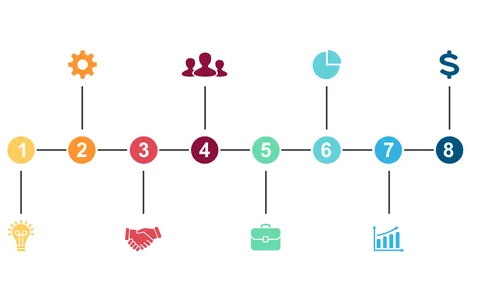
Outline 6-Step Process with Circular Diagram

Product Description
Navigating the intricacies of a process can often confuse your audience, especially when the steps become convoluted. This circular diagram is crafted to break down a 6-step process clearly, making it easy for your team to follow along and understand each component.
Operations managers and process coordinators will find this slide invaluable in presenting workflows during team meetings or training sessions. Whether you’re explaining a new operational process or conducting a workshop, this visual aid will enhance understanding and retention.
Available for just $0.99, this slide is ready for instant download and can be edited in both PowerPoint and Google Slides. It’s designed to be user-friendly, allowing you to customize it quickly and effectively.
$0.99 – Purchase Checkout
Added to cart