Customize Circular 5-Section Diagram for Projects
Product Description
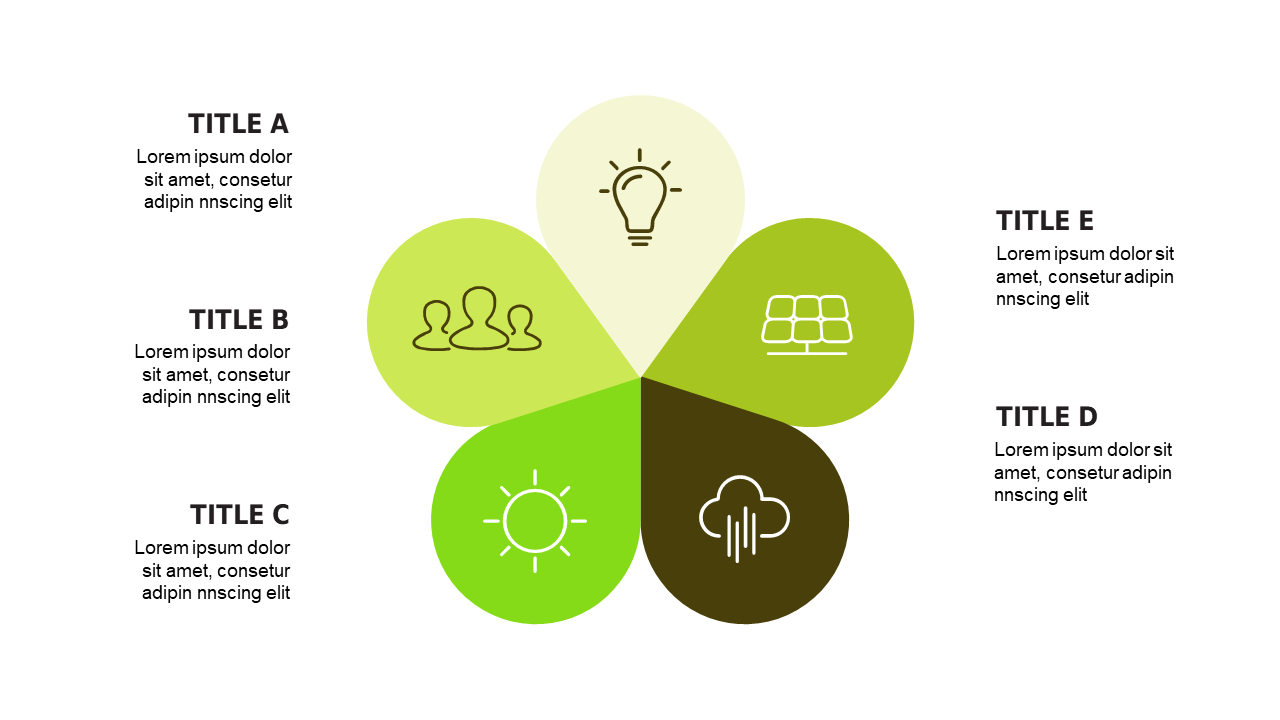
Navigating the intricacies of project data can be tough, especially when clear communication is essential. This circular 5-section diagram is designed to help you illustrate interconnected concepts in a visually appealing way, making it easier for your audience to grasp your message without getting lost in the details.
Think of a business analyst summarizing findings for stakeholders or a product manager outlining project stages in a kickoff meeting. This slide is ideal for any scenario where you need to convey complex information clearly, whether in team updates, client presentations, or strategic feedback sessions. It aids in transforming data into digestible insights.
You can get this slide for just $0.99, and it’s ready for instant download. It’s fully editable in PowerPoint and Google Slides, allowing you to personalize it quickly to suit your specific message and needs in just a few minutes.
$0.99 – Purchase Checkout
Added to cart