Visualize Global Data Points in Circle Diagram
Product Description
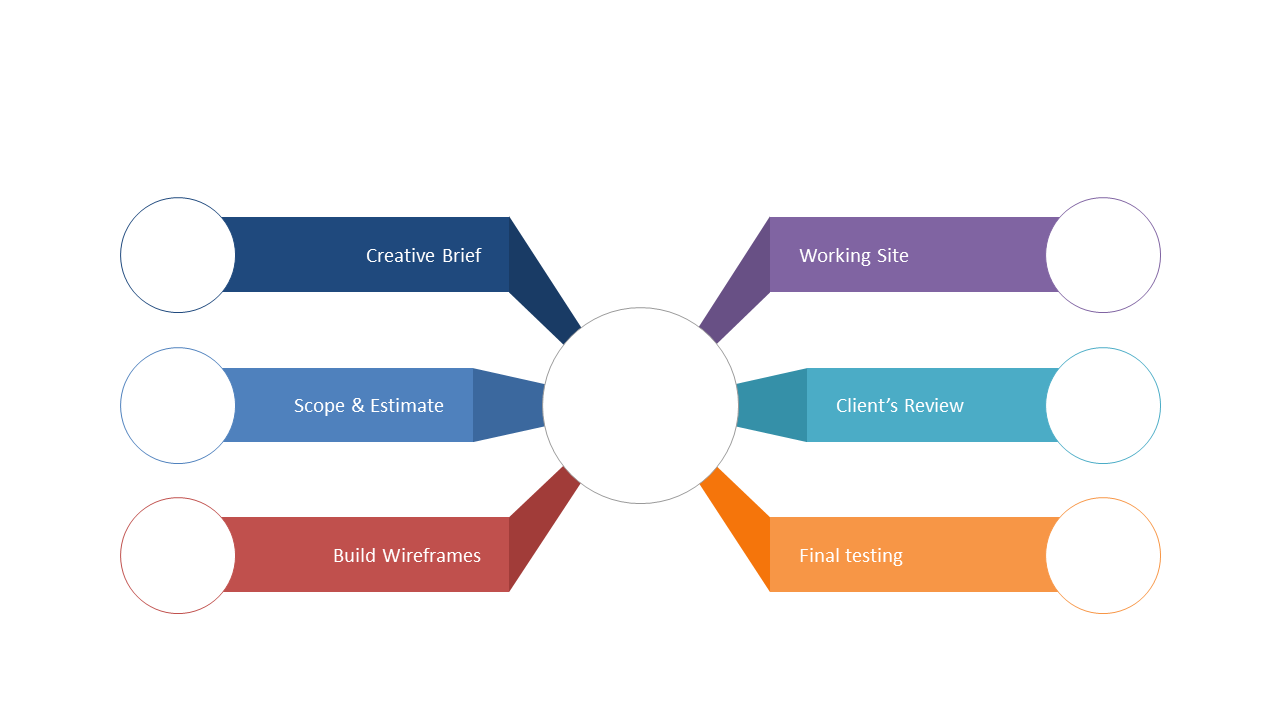
In a world overloaded with data, effectively presenting insights can often be a challenge. This visually appealing circle diagram, set against a global map, simplifies the process by showcasing six interconnected data points that represent global trends.
Its design helps convey complex information in a straightforward manner. This slide is perfect for data scientists, international business strategists, or consultants who need to share insights from global markets during presentations. Use it when discussing findings in global meetings, reports, or conferences where clarity is crucial to convey important information.
For only $0.99, you can instantly download this slide and make it your own. It’s easy to edit using PowerPoint or Google Slides, allowing you to have it ready for your next presentation in mere minutes.
$0.99 – Purchase Checkout
Added to cart