Present Business Model with Key Components Layout

Product Description
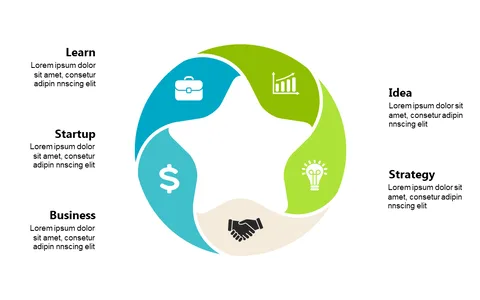
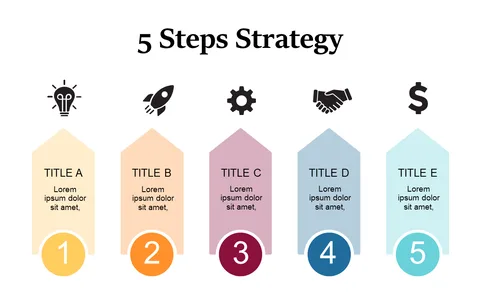
Presenting a business model that resonates with your audience can sometimes feel daunting. The Key Components Layout provides a straightforward visual structure to help you communicate your business’s essential elements, ensuring clarity and focus during your presentation.
This slide is particularly useful for financial analysts discussing revenue streams, project managers outlining project scopes, or executives detailing strategic initiatives. Use it in quarterly reviews to explain performance metrics or during strategic planning sessions to align your team’s understanding of business goals.
Available for just $0.99, this slide can be instantly downloaded and is super easy to edit. You can modify it in PowerPoint or Google Slides, so you can have it ready to go in just a few minutes.
$0.99 – Purchase Checkout
Added to cart