Visualize Key Business Strategies with Colorful Layout

Product Description
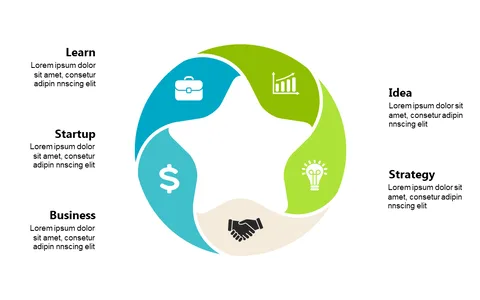
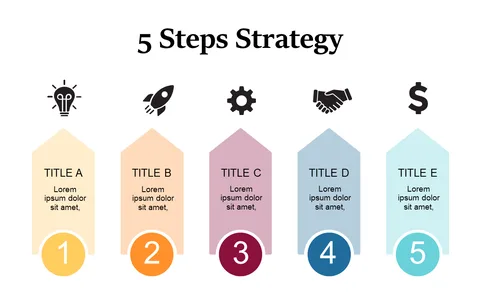
Conveying complex business strategies doesn’t have to feel overwhelming. This colorful slide helps you present intricate ideas clearly through a segmented graphic, making it easier for your audience to grasp key concepts at a glance.
Business analysts and project managers will find this slide useful during strategy sessions, team meetings, or executive briefings. It enables you to break down your strategies and communicate them effectively, ensuring everyone is on the same page and engaged with the material.
At the price of just $0.99, this slide is ready for immediate download. It’s easily editable in PowerPoint and Google Slides, so you can adjust it to fit your specific business strategy without any fuss.
$0.99 – Purchase Checkout
Added to cart