Balance Scale Graphic for Success Metrics

Product Description
Communicating success metrics can be difficult when clarity is paramount. You want to present your achievements in a way that resonates but also effectively showcases the balance between different elements of success.
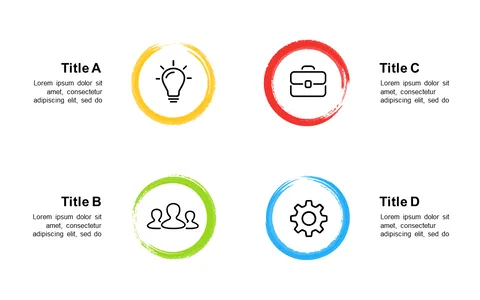
This slide features a striking balance scale graphic, clearly illustrating metrics with defined icons representing awards and accomplishments. It’s particularly useful for executives discussing company performance during quarterly reviews, project leads summarizing project achievements, or marketing teams analyzing campaign successes. This visual tool will help you convey important messages while ensuring your audience understands the impact of your accomplishments.
At just $0.99, this slide is available for instant download and is fully editable in PowerPoint and Google Slides. It’s a quick and straightforward way to enhance your presentation on success metrics.
$0.99 – Purchase Checkout
Added to cart