Engagement Process Visualization with Arrows
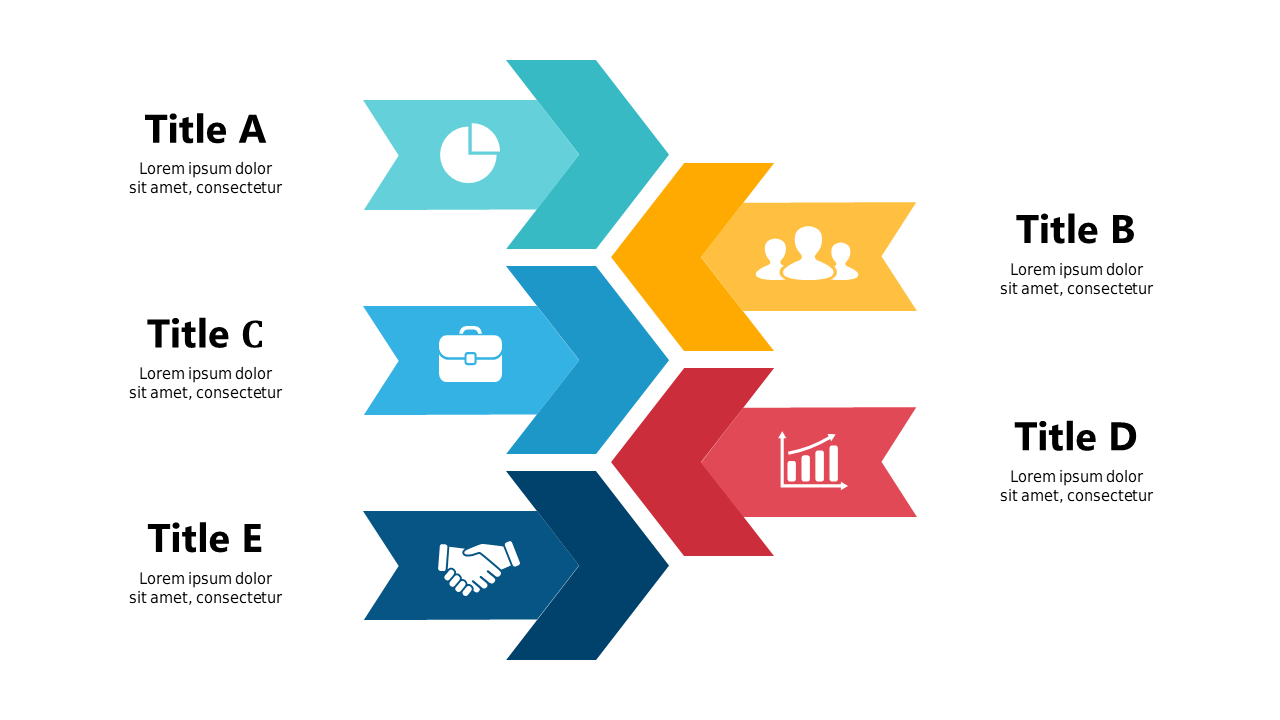
Product Description
Clarifying complex engagement processes can often feel like trying to solve a puzzle without all the pieces. It’s frustrating when your audience struggles to visualize the flow of interactions, whether it’s for partnership discussions or communication pathways. This slide offers a straightforward design with arrows and icons that guide viewers through the engagement process, making it easier for everyone to understand.
Business analysts, project managers, and communication specialists will find this slide particularly useful during stakeholder meetings or strategy sessions. If you’re working on a partnership proposal, showcasing communication processes, or discussing project workflows, this visual tool can help convey the necessary information effectively.
It allows you to break down intricate processes into easily digestible parts. Available for just $0.99, you can download this slide instantly and start editing it right away. It’s fully compatible with PowerPoint and Google Slides, so you can make changes in minutes and tailor it to your specific needs.
$0.99 – Purchase Checkout
Added to cart







