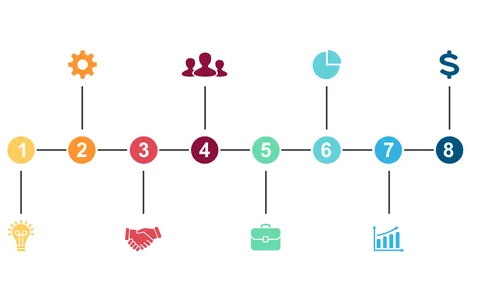
Dynamic Arrow Diagram for Business Processes V9

Product Description
In project management, miscommunication can lead to inefficiencies and frustration among team members. This dynamic arrow diagram visually represents the flow of tasks and decisions, allowing your audience to understand processes and objectives at a glance.
Use this slide during status update meetings or project planning sessions to ensure everyone is on the same page. It’s perfect for team leads, product owners, or anyone involved in managing projects across various industries, including construction, IT, or marketing.
For only $0.99, you can instantly download this slide and customize it in PowerPoint or Google Slides. It’s quick to edit and ready for use in minutes, so you can focus on your project.
$0.99 – Purchase Checkout
Added to cart