Present Project Stages with a 5-Step Process Layout
Product Description
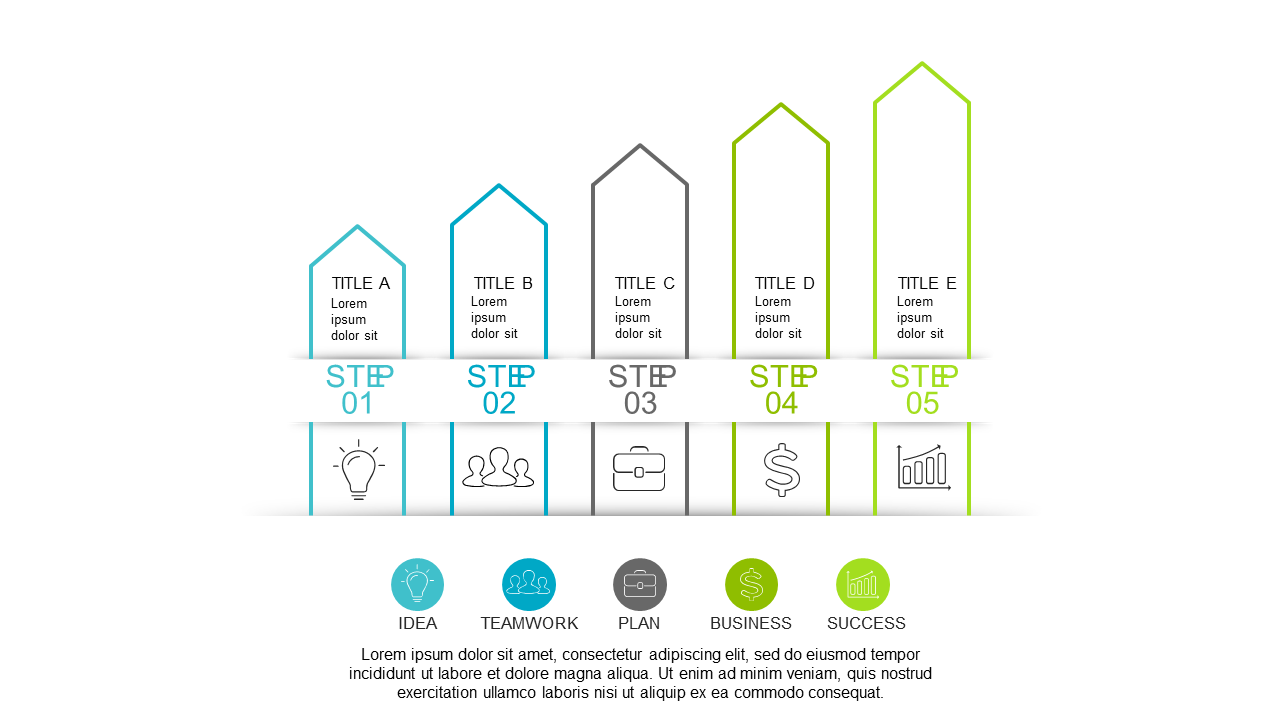
Communicating workflows can often feel overwhelming, particularly when there are multiple stages involved. A visually structured layout with clear arrows and icons helps guide your audience through each step, simplifying the complexity of the process.
This slide is ideal for team leaders updating colleagues on project milestones, sales professionals presenting sales funnels, or operations managers discussing procedural steps. It ensures that everyone understands the flow and can follow along easily.
Available for just $0.99, this slide is ready for instant download and is fully customizable. You can edit it in both PowerPoint and Google Slides, allowing you to adapt it to your specific content in no time.
$0.99 – Purchase Checkout
Added to cart







