Depict Workflows with a Circular 5-Step Diagram
Product Description
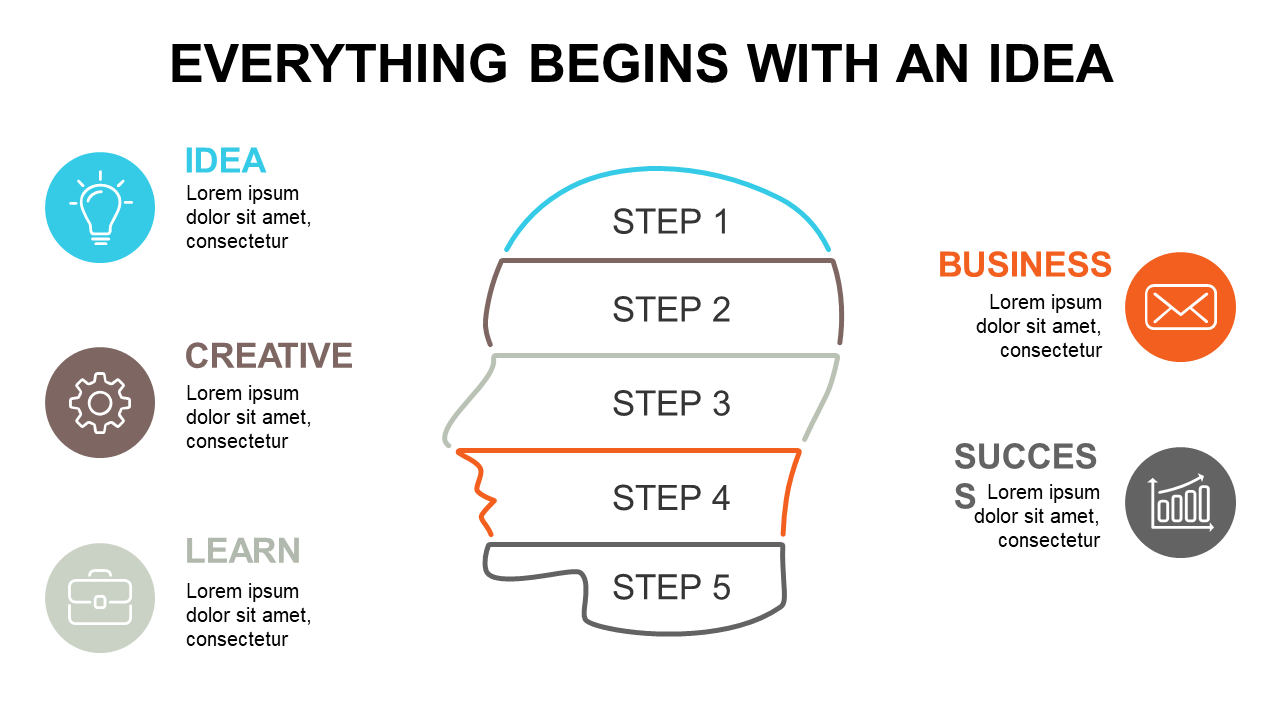
When it comes to presenting workflows, clarity is key. An unclear presentation can leave your audience confused and disengaged. This circular 5-step diagram allows you to depict thought processes visually, making your message clearer and more memorable.
Ideal for business analysts sharing insights or product managers outlining development phases, this slide can adapt to various industries. It’s also useful in training sessions where you need to guide participants through a process step-by-step.
The engaging design encourages connection with your content. Priced at just $0.99, this slide is an instant download that you can easily edit in both PowerPoint and Google Slides. Customize it to fit your needs, and you’ll be ready to wow your audience in just moments.
$0.99 – Purchase Checkout
Added to cart







