Visualize Processes with 5-Step Colorful Indicators
Product Description
Illustrating a complex process clearly can sometimes feel like an uphill battle. When the steps are not represented visually, confusion can arise, leading to misunderstandings.
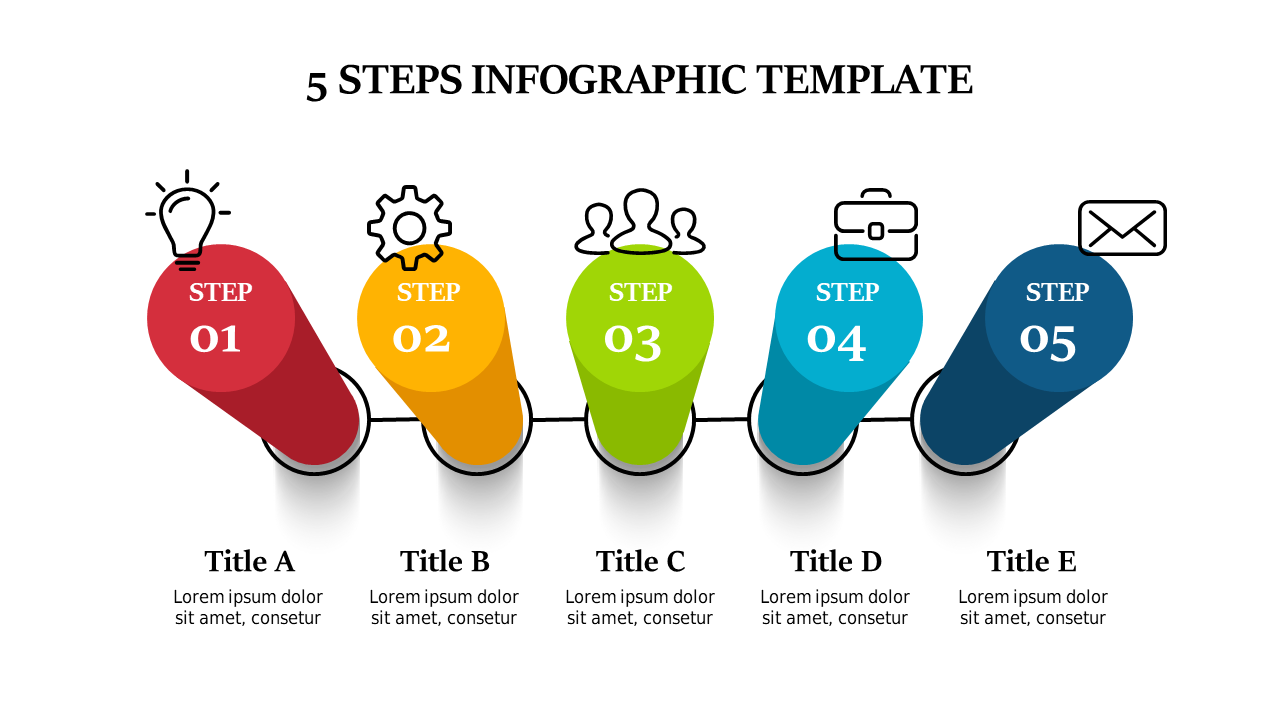
This slide allows you to visualize a five-step workflow with colorful indicators, making it easier for your audience to grasp the sequence of tasks. Sales managers and operations analysts can find this slide particularly useful during presentations on project timelines or process improvements. It serves well in strategy sessions where clarity about steps is vital for successful execution, ensuring everyone is engaged and informed.
Available for just $0.99, this slide is ready for instant download and is easily customizable in both PowerPoint and Google Slides. Spend just a few minutes tailoring it to your presentation, and you’re set to impress your audience with a clear and visually appealing workflow.
$0.99 – Purchase Checkout
Added to cart







