Enhance Presentations with 4-Section Curved Diagram
Product Description
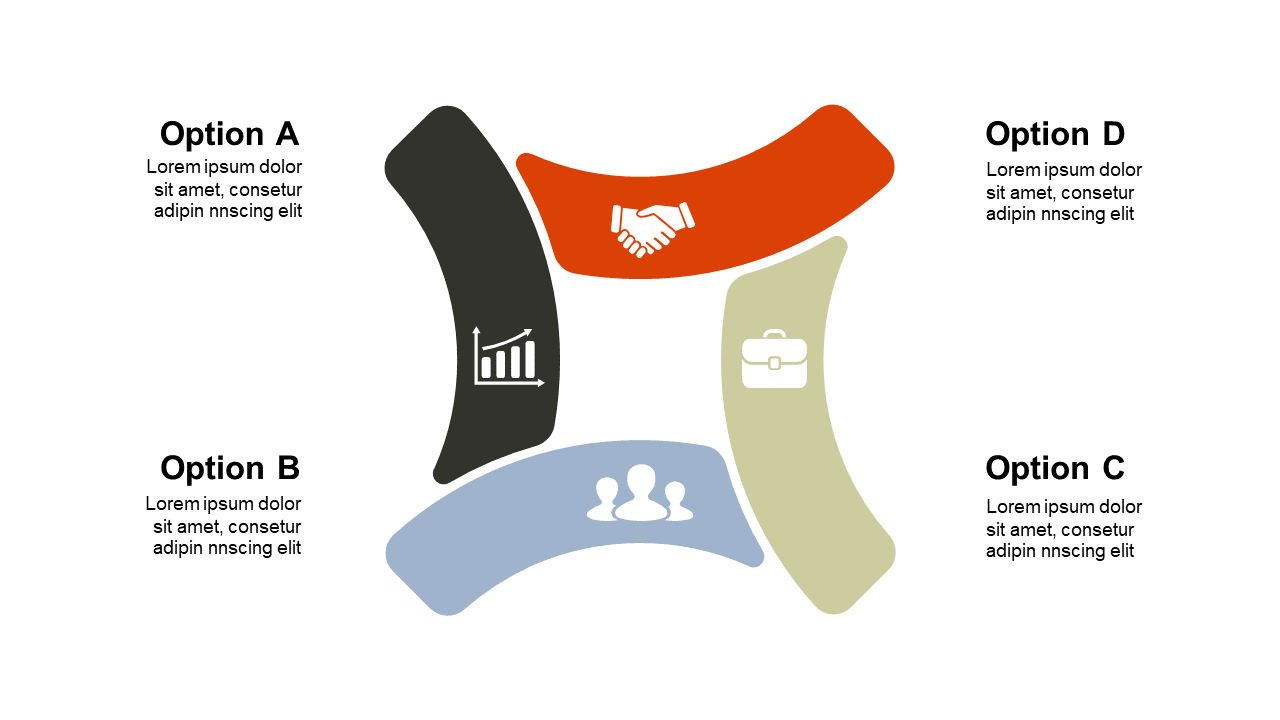
It can be tough to convey intricate processes without the right visuals, especially when your audience needs to grasp several moving parts. This 4-section curved diagram simplifies that challenge by providing a clear structure for your explanations, making the information more accessible and engaging.
You’ll find it easier to capture your audience’s attention and lead them through your narrative. Ideal for operations managers explaining workflows, educators presenting complex theories, or team leaders discussing project phases, this slide can be utilized across various fields. It helps to clarify your message and assists your audience in comprehending the nuances of your discussion, whether in a formal meeting or a casual brainstorming session.
Download this valuable slide for only $0.99. It’s ready for instant access and easy to edit in PowerPoint and Google Slides, so you can tailor it perfectly to your presentation needs in just a few minutes.
$0.99 – Purchase Checkout
Added to cart