Showcase Multi-Faceted Information with 3D Cube
Product Description
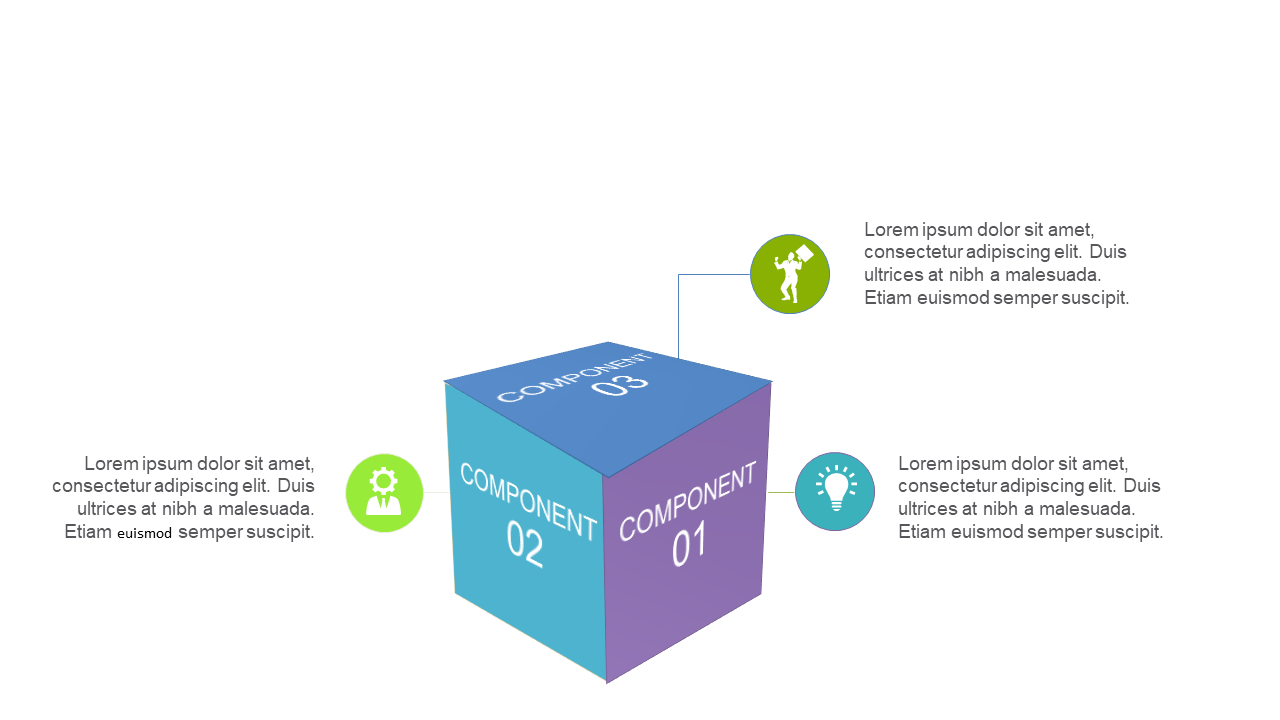
Turning complex data into something your audience can grasp isn’t always easy, especially when you’re juggling multiple information sets. This 3D cube slide allows you to present various facets of information in a visually appealing way, helping to clarify relationships and trends without overwhelming your audience.
Business analysts preparing reports, marketers analyzing campaign performance, or project managers showcasing multi-dimensional data can benefit greatly from this slide. Whether you’re in a strategy meeting, a client presentation, or a data review session, it gives you the means to keep your audience engaged and informed throughout your presentation.
Available for just $0.99, this slide is ready for instant download and is fully editable in both PowerPoint and Google Slides. You can easily tailor it to meet your specific needs, making your work easier and faster.
$0.99 – Purchase Checkout
Added to cart







