Showcase a 3-Step Process with Icons in Slides
Product Description
When you’re managing operations, clear communication is essential, especially for multi-step processes. It’s easy for your audience to become lost in details without a simple visual aid to guide them.
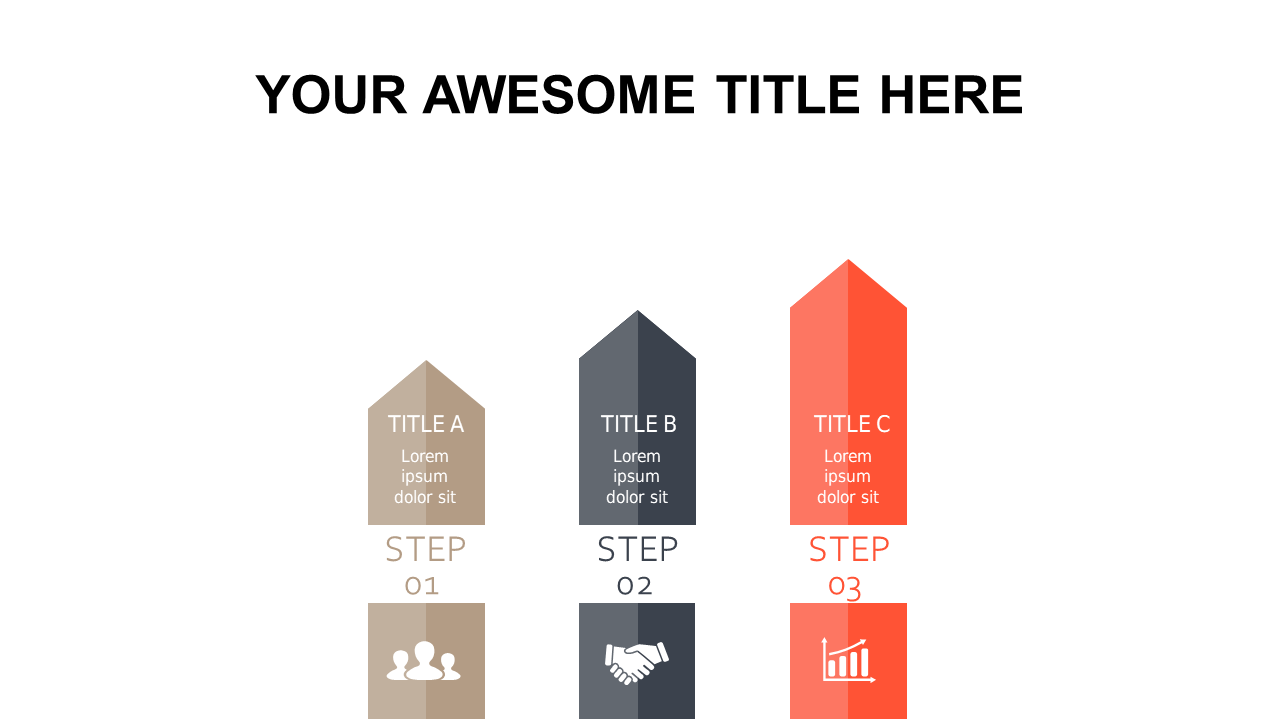
This straightforward slide showcases a 3-step process with intuitive icons and titles that clarify your message. Perfect for operations managers outlining workflows, team leaders discussing project timelines, or consultants presenting strategies, this slide is designed to keep everyone on the same page. Whether you’re presenting in a strategic meeting or leading a training session, this visual aid will enhance your communication.
For just $0.99, you can download this slide instantly and edit it easily in PowerPoint or Google Slides. Get started on your professional presentation today!
$0.99 – Purchase Checkout
Added to cart