Visualize Business Concepts with 3-Point Flow V2
Product Description
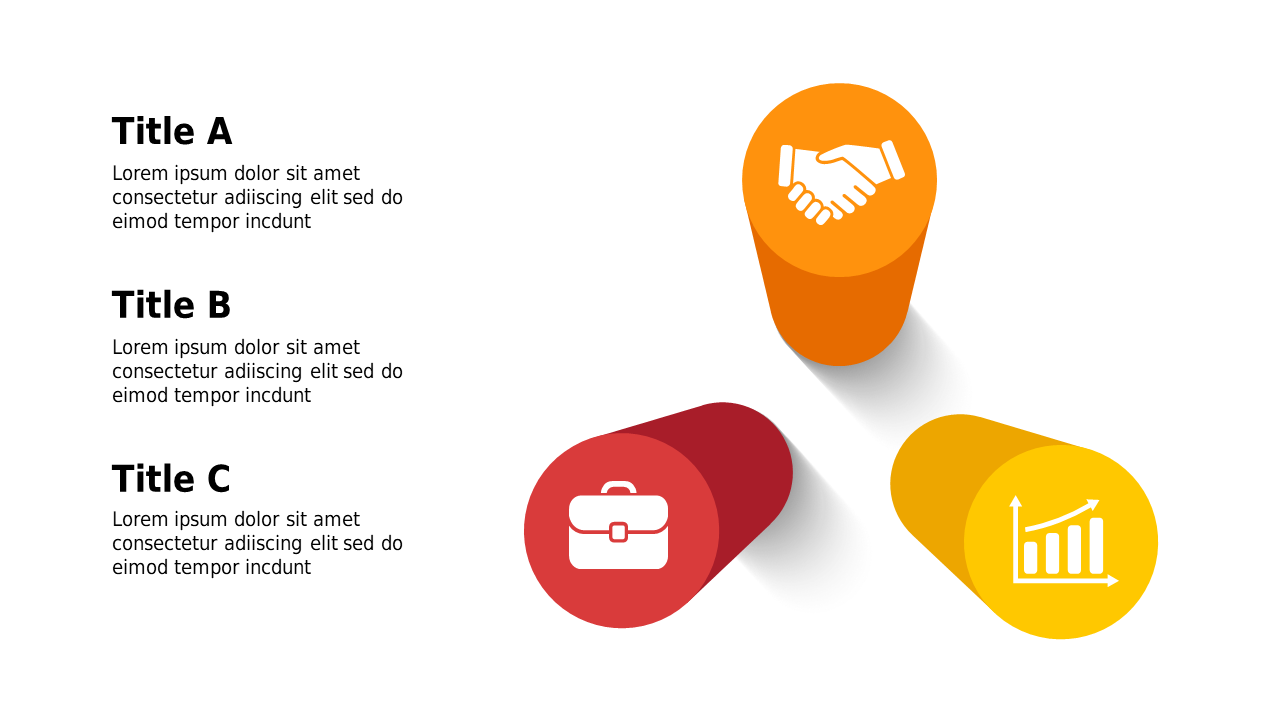
Navigating through complex business processes can be tricky, especially when you aim to communicate ideas without losing clarity. If you often find your audience lost in the details, this slide makes it easier to visualize key concepts using a clean 3-point flow design.
The use of three distinct circular icons helps break down essential elements for your audience. This slide is ideal for business development managers discussing strategic partnerships or finance professionals explaining budget allocations. Picture it in your next business review presentation, clearly illustrating your points and keeping the discussion focused on critical areas.
For just $0.99, you can download this eye-catching slide and make it your own. It’s simple to edit in PowerPoint and Google Slides, ensuring you can tailor it to fit your specific context in just a few moments.
$0.99 – Purchase Checkout
Added to cart