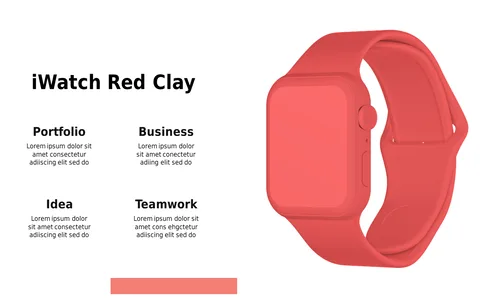
Product Usability vs Design Comparison Slide
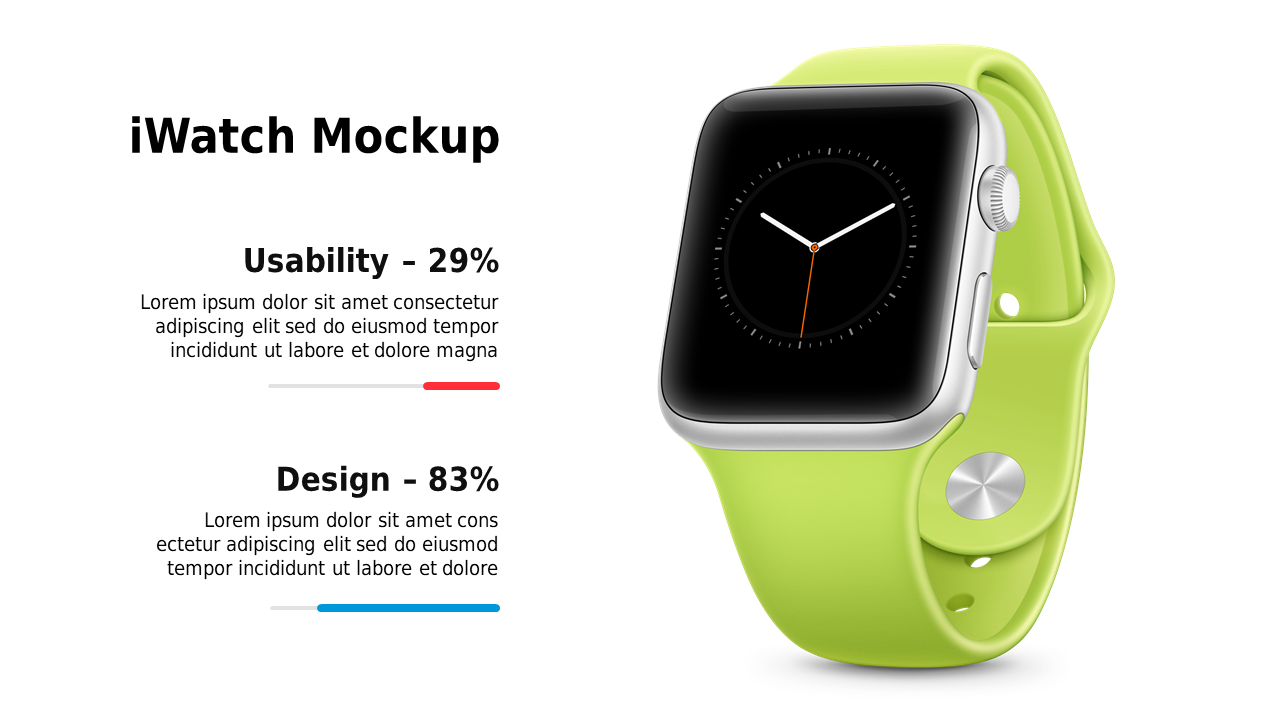
Product Description
Highlighting the balance between usability and design in your presentations can be pivotal for convincing your audience. When pitching a smartwatch, you want to make sure both aspects are clearly communicated, without cluttering the slide with too much detail.
This slide helps you present a straightforward comparison that will resonate with your audience. Ideal for marketing directors, UX designers, and product managers, this layout shines in settings like product demos, usability reviews, or design critique meetings. Visualizing how usability stacks up against design will make your presentation memorable and engaging, especially when discussing the smartwatch’s place in the market.
At just $0.99, this slide can be instantly downloaded and customized to fit your specific needs. You’ll find it easy to edit in both PowerPoint and Google Slides, allowing you to tailor it for your upcoming presentation in just a few minutes.
$0.99 – Purchase Checkout
Added to cart