Customizable 5-Step Progress Bar for Business Milestones
Product Description
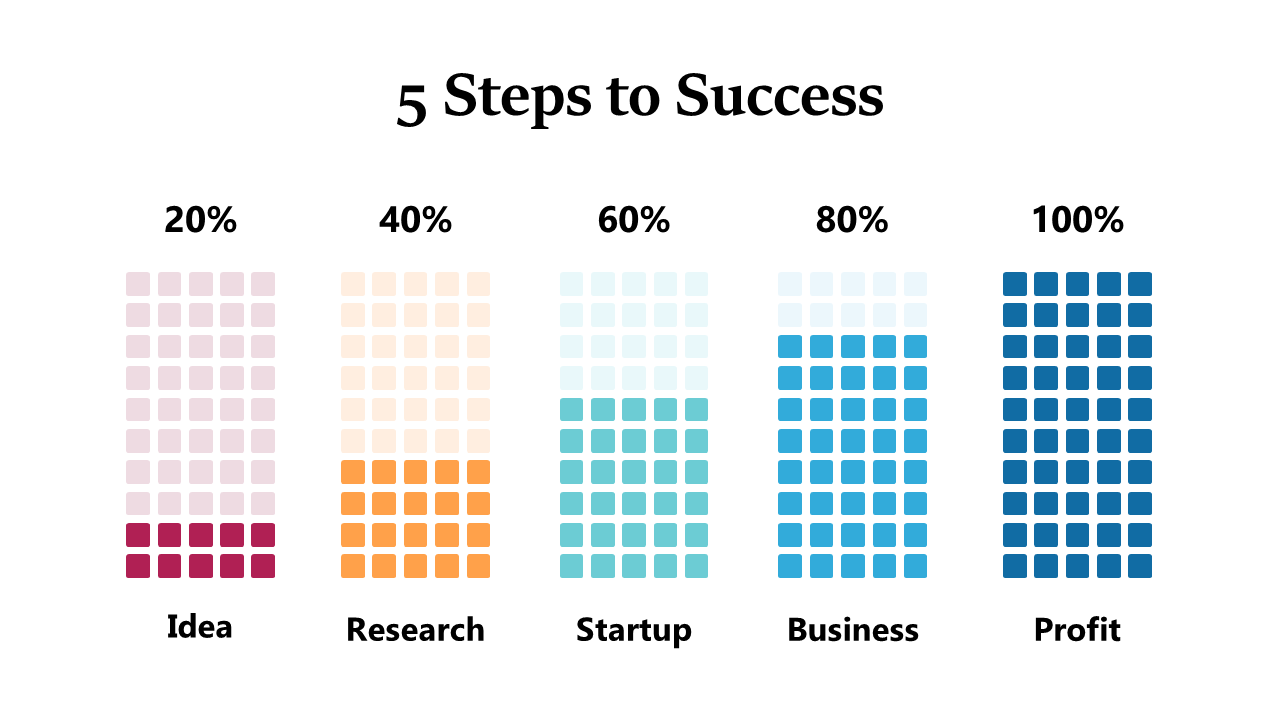
Communicating project milestones can often feel overwhelming, especially when you’re juggling numerous details. This customizable 5-step progress bar visually organizes your project’s stages, making it easier for your audience to follow along and understand your achievements.
Ideal for business analysts, project managers, and executives, this slide fits perfectly into quarterly review meetings, project kick-off sessions, or client updates, allowing you to convey progress in a straightforward manner. No matter your industry, this visualization will keep your audience engaged and informed.
For just $0.99, you can download this slide and customize it within PowerPoint or Google Slides with ease. Editing the progress percentages and descriptions takes just minutes, ensuring you’re presentation-ready without the fuss.
$0.99 – Purchase Checkout
Added to cart







