Visualize Your Journey from Idea to Startup
Product Description
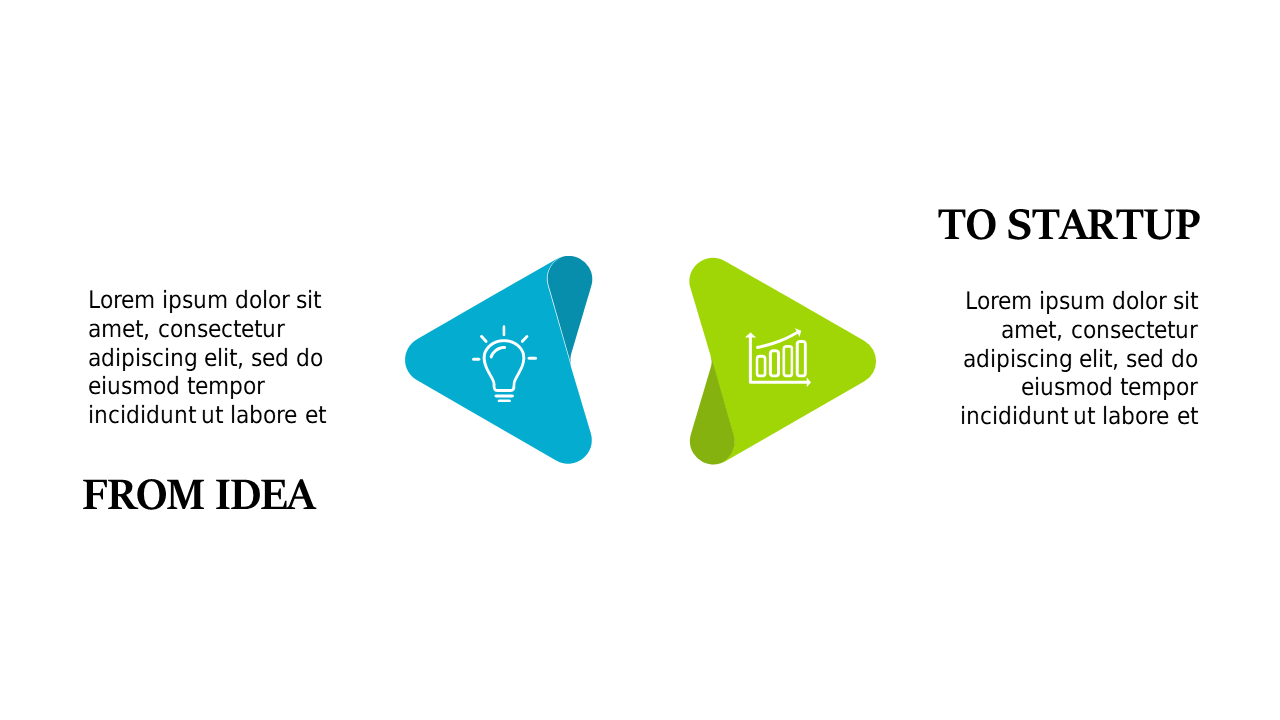
Translating your entrepreneurial journey from an idea to a fully functioning startup can be a daunting task. This slide takes the complexity out of storytelling by visually mapping out your process in a clear, triangular flow, allowing you to share your vision with confidence and clarity.
Use this slide during investor pitches, startup workshops, or brainstorming sessions with your team to illustrate how your concept evolves into a market-ready product. Founders, business analysts, and innovation managers can effectively communicate milestones and challenges while maintaining your audience’s attention.
For only $0.99, this slide is ready for your immediate download and is editable in both PowerPoint and Google Slides. Modify the elements effortlessly to fit your narrative and make your startup journey resonate in just a few clicks.
$0.99 – Purchase Checkout
Added to cart







