Present Clear Steps with Vertical Process Diagram
Product Description
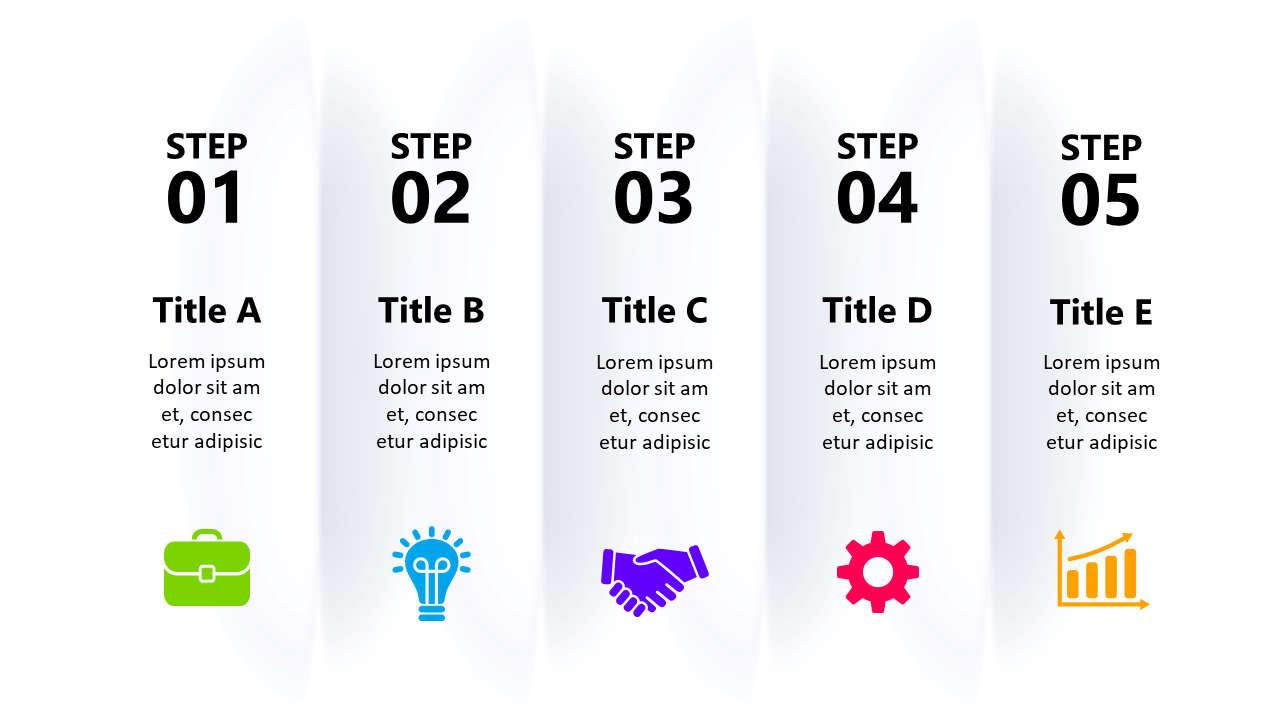
Explaining a multi-step process can lead to confusion if not presented clearly, often leaving your audience lost in details. This slide offers a straightforward vertical diagram, featuring five distinct steps, each supported by an icon and ample text space.
This design is specifically crafted to guide your audience through complex sequences with ease. Business analysts, consultants, and training coordinators can use this slide for process training sessions, strategy meetings, or when presenting procedural documentation. It allows you to illustrate intricate workflows without overwhelming your viewers, ensuring they follow along without getting lost.
Available for just $0.99, this slide is ready for immediate download and can be easily customized in PowerPoint or Google Slides. Tailor it to your needs and have a clear, engaging presentation prepared in no time.
$0.99 – Purchase Checkout
Added to cart







